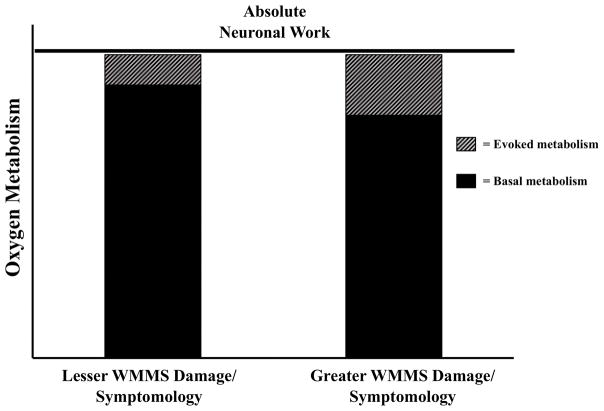
Figure 7.
Interpretation of CMRO2 differences between MS patients with lesser WMMS damage/symptomology versus those with greater WMMS damage/symptomology. This shows differential basal and task metabolism but similar absolute neuronal work across MS participants (baseline + task; see Hyder et al., 2002; Shulman et al., 2007; Pasley et al., 2007).

