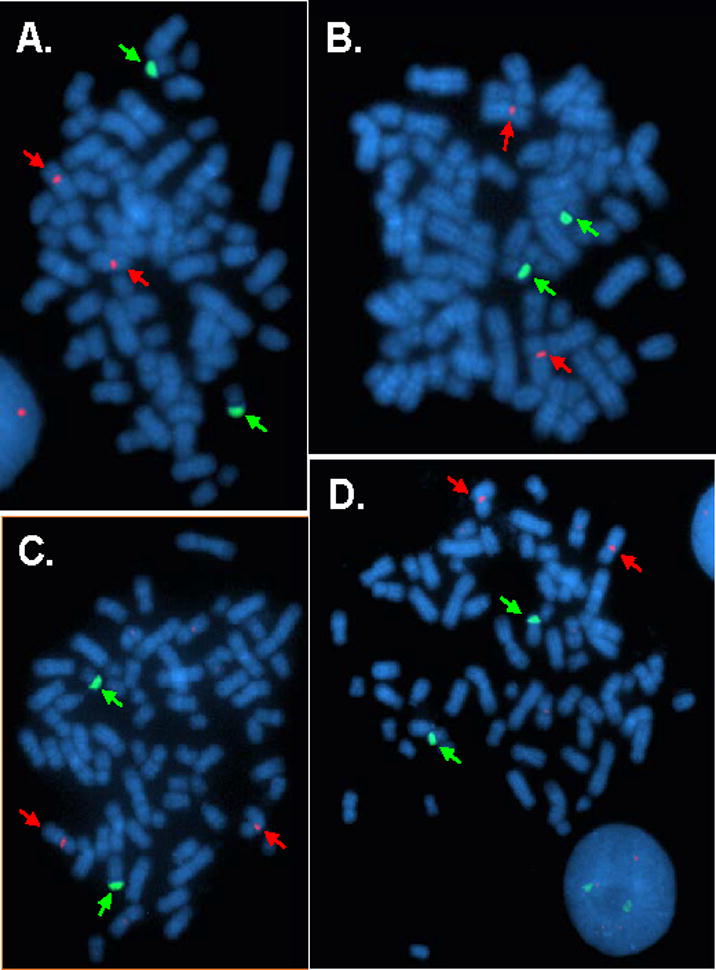
Figure 3. FISH Analysis of M14 using X- and Y-specific probes.

Metaphase spreads of M14 cell line, hybridized with the CEP X SpectrumOrange/Yq12 SpectrumGreen FISH probe set (Abbott Molecular). Red arrows indicate Xp11-q11 and green arrows indicate Yq12 hybridization signals. Images 3A-B show two similar copies of der(22)t(Y;22), while 3C-D exhibit two different derivative chromosomes bearing Yq12; namely, the above der(22) and another unknown variant.
