
Figure 1.
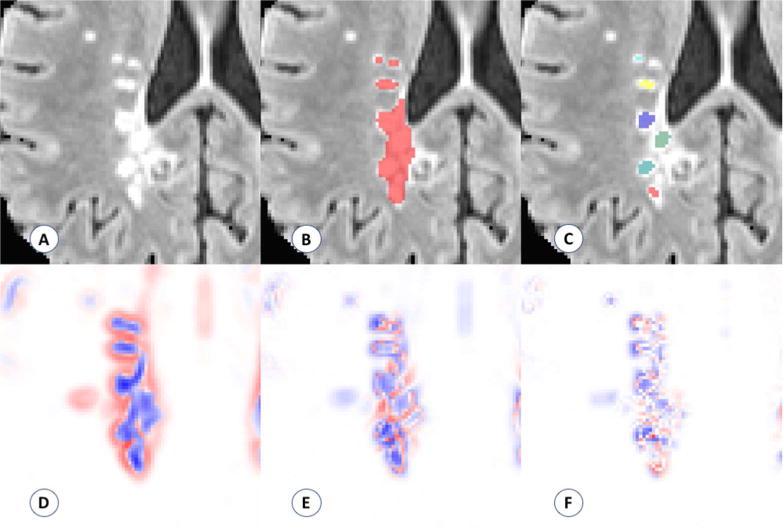
Visualization of the performance of the proposed count. (A) Example of region with confluent lesion tissue. (B) Connected components method finds one confluent lesion in the highlighted region. (C) Proposed method finds six distinct lesion centers in the highlighted region on the visualized axial slice. (D–F) Maps of the three Hessian eigenvalues used to quantify lesion texture and find distinct lesion centers (red represents positive eigenvalues, blue represents negative eigenvalues).