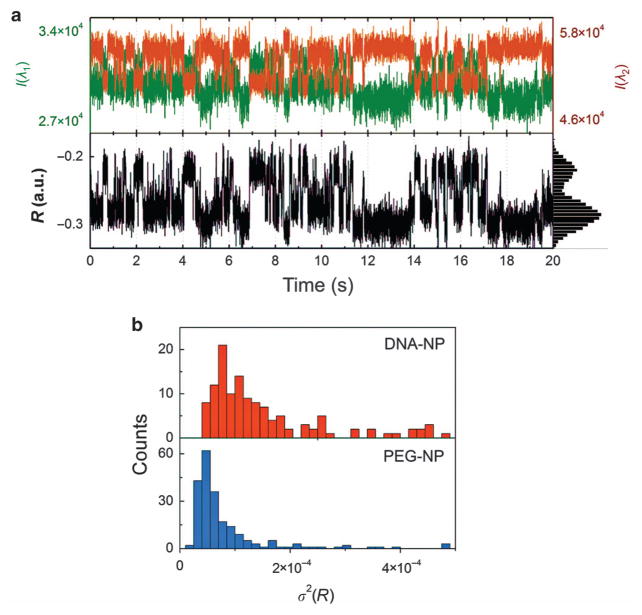
Figure 4.
Spectral fluctuation in NP-liposomes that contained two co-confined NPs. (a) Scattering trajectories for a NP-liposome with DNA-NPs at pH =8. The top panel shows the scattering intensities recorded on the I(λ1) and I(λ2) channels; the bottom channel shows the calculated R values. (b) Histogram of σ2(R) for ~ 200 NP-liposomes containing DNA-NPs (top) or PEG-NPs (bottom) at pH =8. A two-sample t-test was applied to the data at log 10 scales and confirmed that the difference in distributions for DNA-NPs and PEG-NPs is highly significant (P<0.0001). DNA-NP, DNA-functionalized NP; NP, nanoparticle; PEG-NP, polyethylene glycol-functionalized NP.

