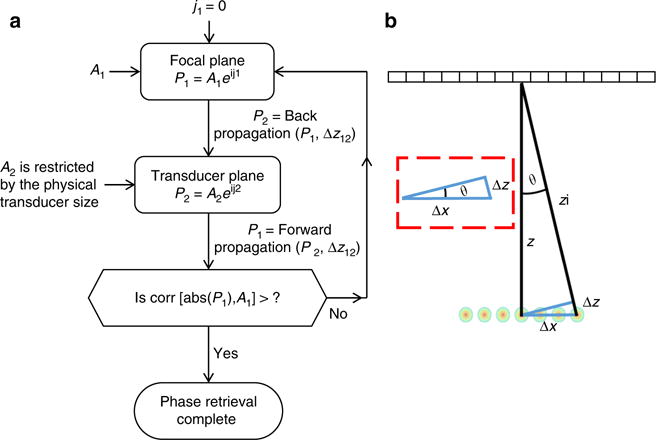
Fig. 3.

Design of the focal pattern, including constraints imposed on the number of foci. a Flowchart of the modified Gerchberg–Saxton process designed to create the pressure P1 at the focus based on the pressure P2 on the transducer surface. Initially, the desired focal pattern amplitude, A1, and its distance z from the transducer are defined and a zero phase φ1 is imposed. This field is back propagated to the transducer plane using the angular spectrum method. The result is the amplitude A2 and phase φ2 that define the second plane P2. An iterative process continues until the correlation coefficient between A1, and the desired amplitude, is higher than a pre-determined threshold. b Geometric model for the temporal and spatial interference requirement
