
Fig. 4.
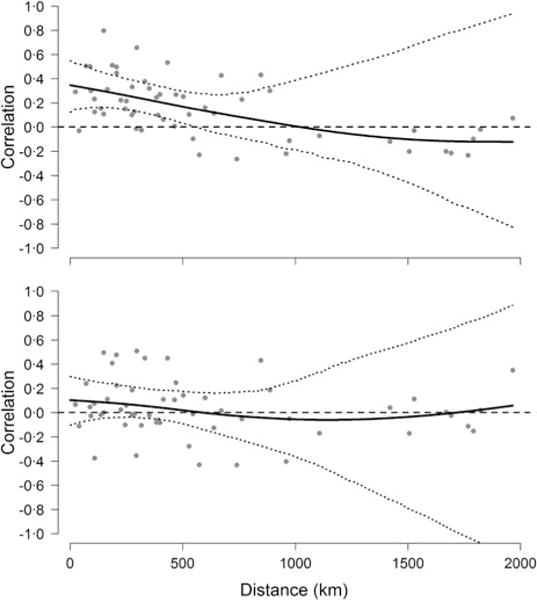
Synchrony of Hendra virus prevalence across sites. Top figure shows pairwise correlation coefficients between time series of Hendra virus prevalence as a function of geographical distance, whereas the bottom figure shows pairwise correlations of the change in Hendra virus prevalence. Solid line is fit from a spline regression model with 95% confidence intervals delineated by the dotted lines and obtained from a bootstraping procedure.