
Fig. 5.
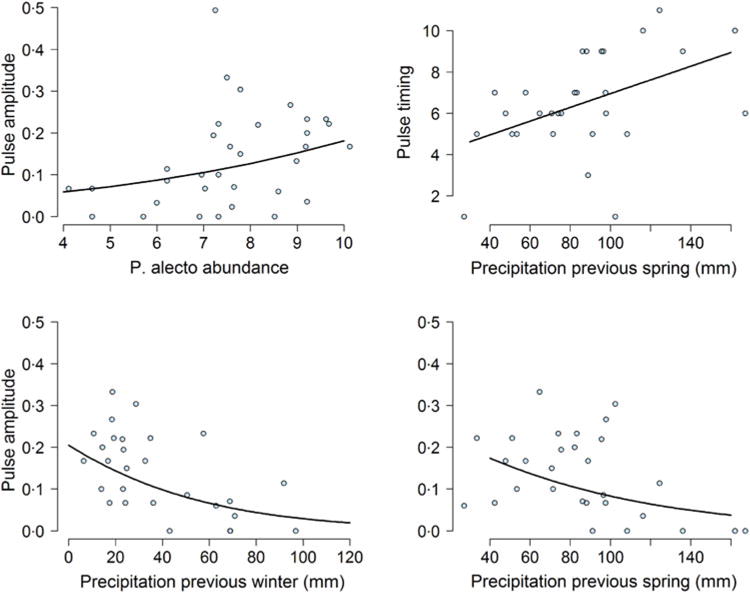
Effect of climatic and biotic variables on the amplitude of the highest annual pulse of Hendra virus prevalence. Top left shows the effect of the mean natural logarithm of Pteropus alecto counts (abundance) on pulse magnitude over the month when the pulse occurred. Top right and bottom panels show the effect of previous precipitation on pulse timing and pulse amplitude. In all panels, the solid line was obtained from the model fit.