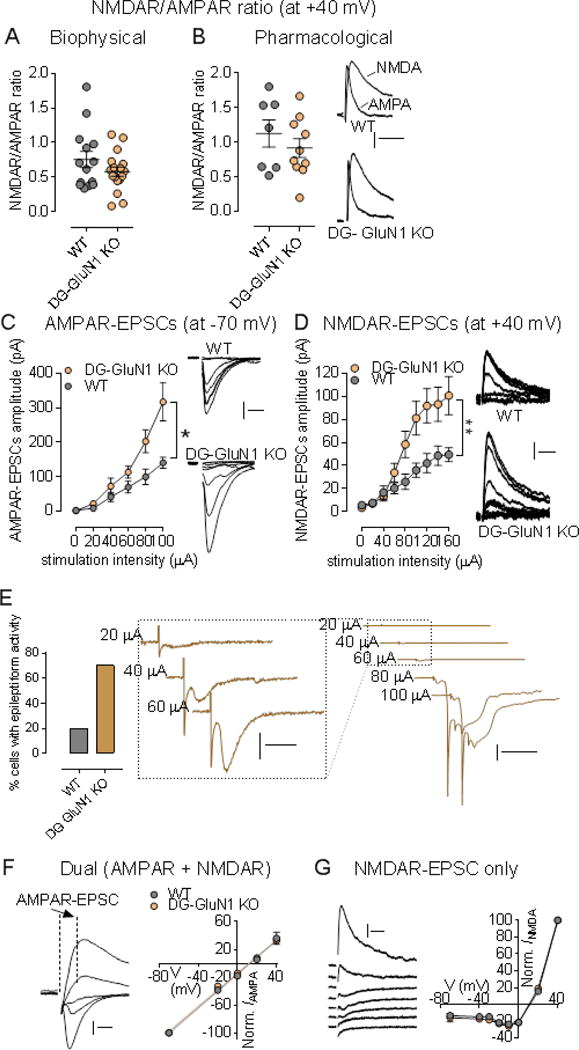
Figure 2.

(A-B) NMDAR/AMPAR ratio values from neurons in cont (grey circles; n = 8 cells, 5 mice) and DG-GluN1 KO mice (orange circles; n = 7 cells, 6 mice). Hash marks indicate mean values ratio in cont and DG-GluN1 KO. Both biophysical (A) and pharmacological (B) approaches showed that NMDAR/AMPAR ratio in cont is similar to that of found in DG-GluN1 KO mice (p > 0.05). For biophysical approach, AMPAR- and NMDAR-EPSC amplitudes are extracted from the dual component obtained at +40 mV, at 10 and 50 ms post-stimulus respectively. For pharmacological approach: D-APV at 50 μM was used to extract AMPAR-mediated current. Calibration: 50 ms, 20 pA. (C-D) Both AMPAR- (C) and NMDAR-mediated transmission (D) at MF-CA3 synapses are increased. AMPAR-mediated transmission was assessed at −70 mV, and NMDAR-mediated current was elicited at +40 mV. Right panels for B and C: Example of AMPAR- (Calibration: 10 ms, 50 pA) and NMDAR-EPSCs traces (Calibration: 50 ms, 20 pA) from a cont and a DG-GluN1 KO neuron over the stimulus range 0, 20, 40, 60, 80, and 100 μA. cont, n = 10 cells, 4 mice; DG-GluN1 KO, n = 16 cells, 4 mice. Two-way ANOVA: genotype and genotype X stimulation interaction effects for both AMPAR- (Genotype effect: F(1, 24) = 4.312, *p = 0.048, and interaction effect: F(4, 96)= 3.850, **p = 0.006) and NMDAR-EPSCs (Genotype effect: F(1, 17) = 5.336, *p = 0.033, and interaction effect: F(8,136) = 6.160, ***p < 0.0001). (E) Left panel, Percentage of cells demonstrating eplileptiform activity indicated by more frequent late burst EPSC recruitment achieved at lower stimulus intensities was significantly higher at DG-GluN1 KO mice (12/16 cells) compared with cont (2/10 cells). Right panel, Sample traces from CA3 pyramidal neurons from DG-GluN1 KO mice. Calibration in left: 20 ms, 50 pA; calibration in right: 100 ms, 1 nA. (F) Left, Examples of evoked dual EPSCs at membrane potentials from −80 mV to +40 mV. Calibration: 10 ms, 50 pA. Right, I–V relationship for AMPAR EPSCs (measured by extracting the AMPAR current from the dual-component at 10 msec post-stimulus) in cont and DG-GluN1 KO mice (n = 8-10 cells, 5 mice in each group). The lines represent the linear regression (r = 0.99 for each group). (G) Left, Examples of evoked NMDAR-mediated EPSCs at membrane potentials from −80 mV to +40 mV. Calibration: 50 ms, 20 pA. Right, I–V relationship for NMDAR-mediated EPSCs in cont and DG-GluN1 KO mice (n = 5-11 cells, 3-4 mice in each group). Holding potentials were not corrected for liquid junction potential. Data are represented as means ± SEM.
