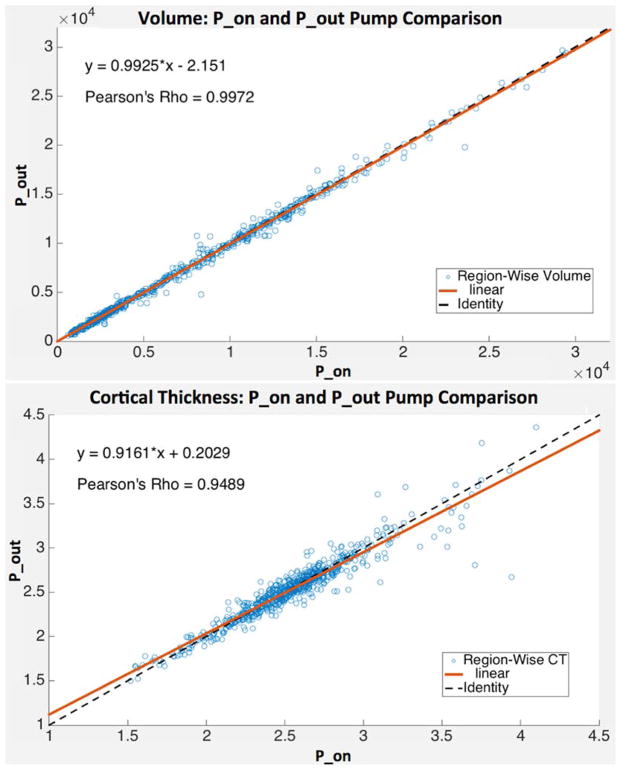
Figure 4.
Human MP-RAGE and Freesurfer-derived volume (TOP) and cortical thickness (BOTTOM) estimates for P_on (pump in the room and on; x-axis) and P_out (no pump or cable in room; y-axis) (N = 10). Lines of best fit shown with solid orange lines and identity shown with dashed black lines. Equations of best fit lines and Pearson’s Rho displayed.

