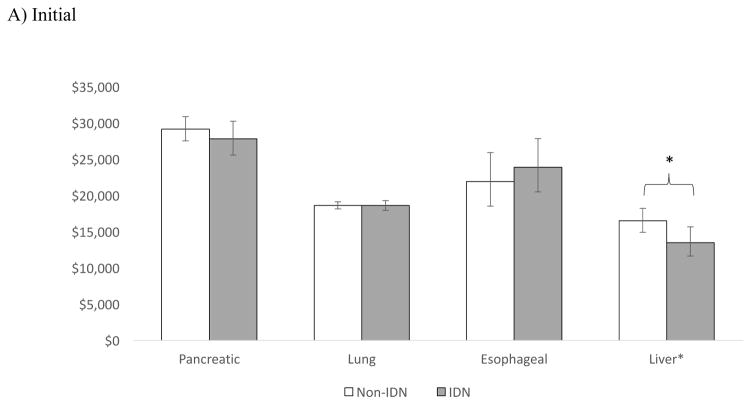
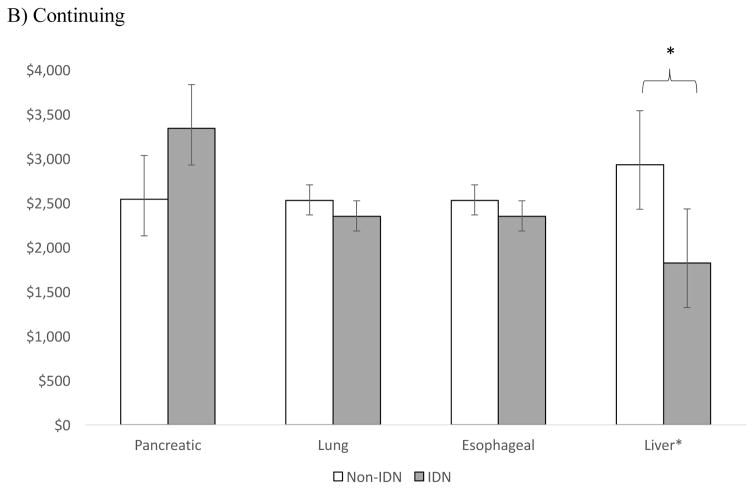
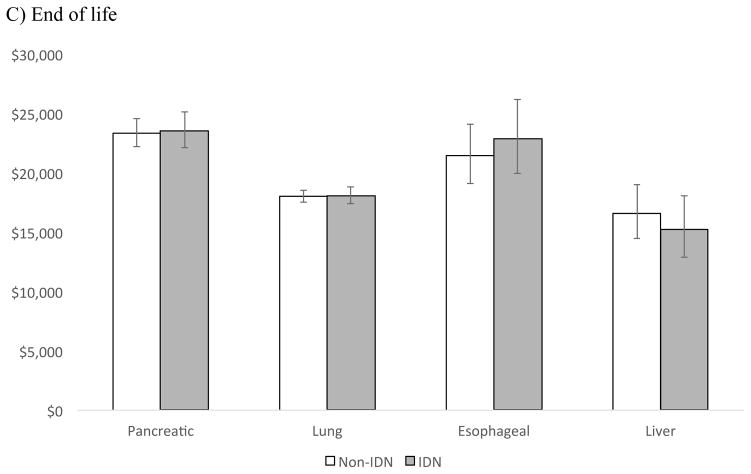
Figure 3.
Adjusted** average annual costs of cancer for IDN vs. Non-IDN hospitals in A) Initial B) Continuing and C) End of life phase, for cancers with the lowest 5- year survival
*p <0.05
** Adjusted for patient (age, sex, number of Charlson co-morbidities, marital status), hospital (geographic region, number of beds, urban/rural, hospital ownership, surgical volume), and cancer (stage, grade) characteristics


