Fig. 5.
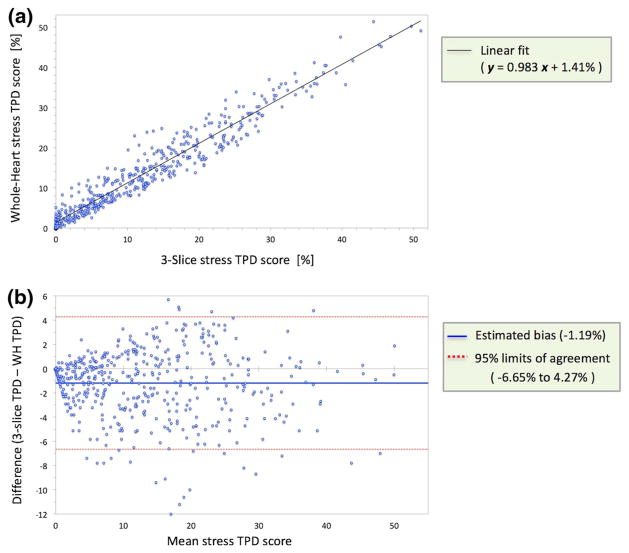
Evaluation of correlation and agreement between whole-heart versus 3-slice stress TPD scores in patients with significant CAD (≥ 70% stenosis; n = 464). a Scatter plot and linear regression of wholeheart TPD against 3-slice TPD showing a very strong correlation (R2= 0.93, P < 0.001) but a noticeable intercept of 1.41% (95% CI: 1.01% to 1.80%) indicating the presence of a systematic bias. b Bland–Altman analysis demonstrates a moderate level of agreement between whole-heart and 3-slice TPD scores that decreases at higher TPD values (95% limits of agreement: − 6.65% to 4.27%), and a small but significant systematic bias of − 1.19% (P < 0.0001; 95% CI: − 1.45% to − 0.94%). CAD coronary artery disease, CI confidence interval, TPD total perfusion deficit

