
Fig 3.
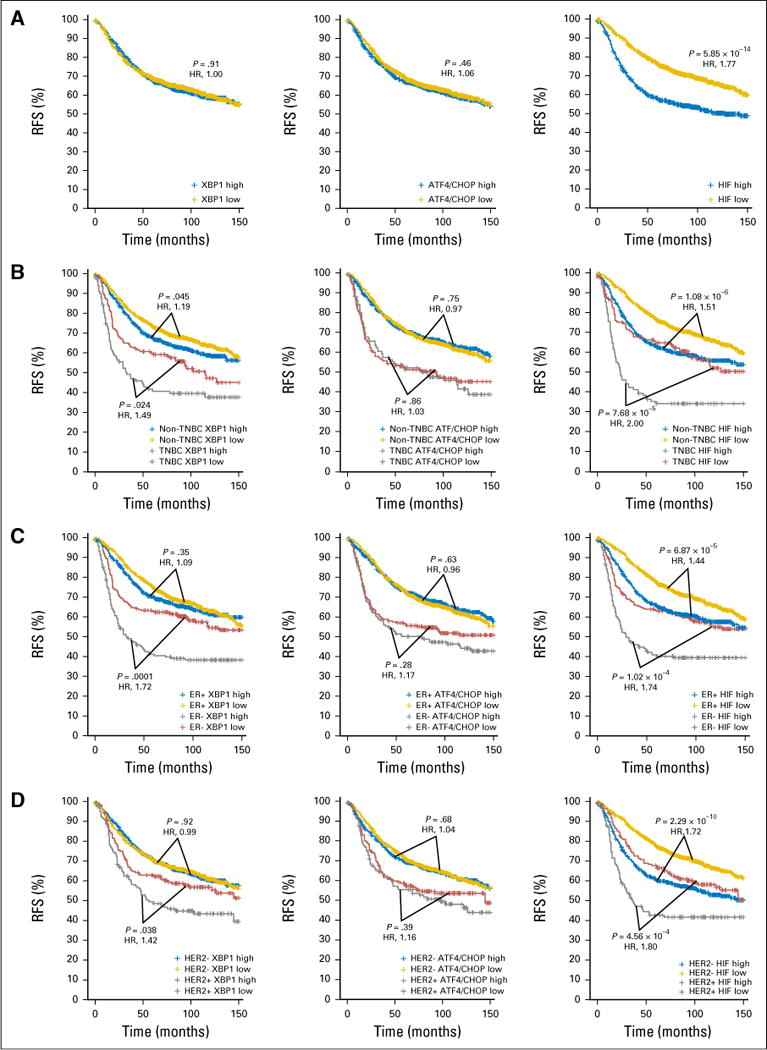
Kaplan-Meier graphs showing relapse-free survival (RFS) of the different subtypes of patients with breast cancer stratified by the XBP1, ATF4/CHOP, or HIF1α gene signatures. Kaplan-Meier graphs of RFS of (A) the total of 1,640 patients, (B) 225 patients with triple-negative breast cancer (TNBC) and 1,415 with non-TNBC, (C) 1,286 who are estrogen receptor (ER)+ and 354 who are ER−, or (D) 270 who are HER2+ and 1,370 who are HER2− with RFS ≤ 150 months separated by high and low (with the 58th percentile cutoff used previously4) levels of the average expression of the XBP1 (left column), ATF4/CHOP (middle column), or HIF1α (right column) gene signature. P values are after Benjamini-Hochberg correction from log-rank (Mantel-Cox) test and the hazard ratios (HRs; higher expression compared with lower expression) are shown in red.