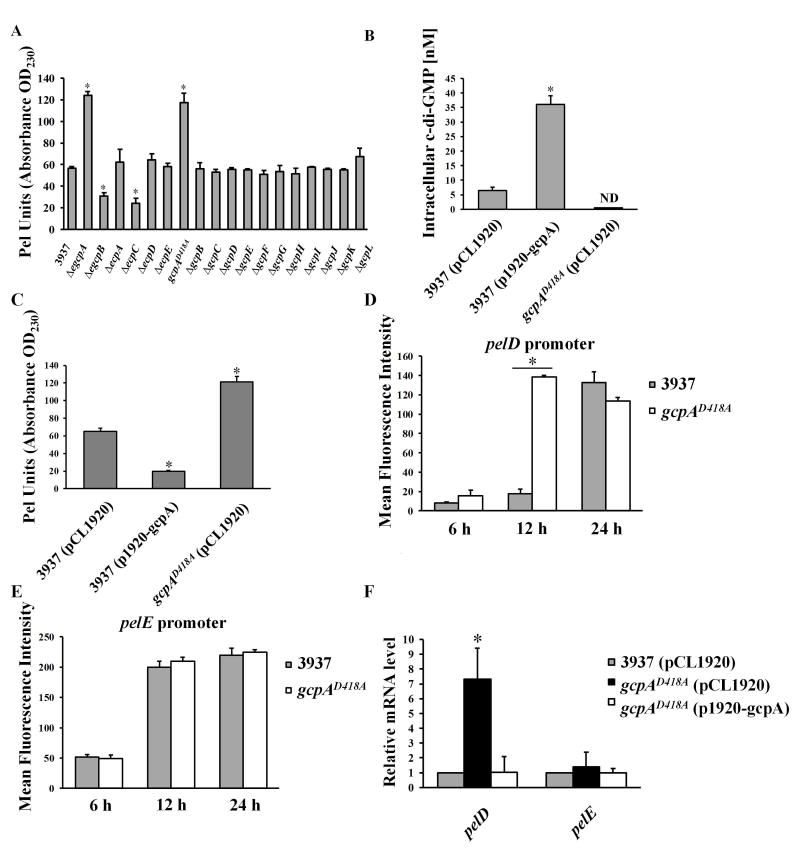
Fig. 1.
GcpA synthesizes c-di-GMP to negatively regulate Pel production and pelD gene expression in D. dadantii. (A) Pel production of wild-type D. dadantii and GGDEF and/or EAL deletion mutant strains cultured in MM+0.1% PGA for 12 h at 28°C. (B) Measurement of intracellular c-di-GMP and (C) Pel production in wild-type D. dadantii harboring empty vector pCL1920, wild type harboring pCL1920-gcpA and gcpAD418A harboring pCL1920-gcpA strains. The pelD (D) and pelE (E) promoter activities were measured in the parental strain D. dadantii and gcpAD418A. Cells cultured in MM+0.1% PGA were harvested at 6, 12 and 24 h respectively to measure the mean fluorescence intensity (MFI) by flow cytometry. (F) Quantitative RT-PCR (qRT-PCR) analysis of mRNA levels of pelD and pelE in D. dadantii strains. The data represent expression levels of each gene relative to that in the wild type, which was mathematically designated as 1. rplU gene was used as an endogenous control for the calculation. All results are from one representative experiment. Three independent experiments were performed and three replicates were used for each experiment. Error bars indicate standard errors of the means. ND represents not detectable. Asterisks indicate statistically significant differences of the means (P<0.05 by Student’s t test).

