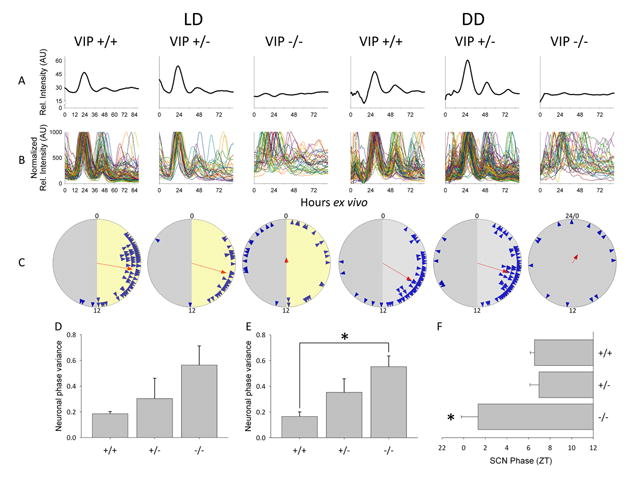
Figure 2.

Ex vivo circadian gene expression rhythms from SCN and clock neurons. Left to right: example ex vivo SCN Per1∷GFP imaging data from VIP wildtype (+/+), heterozygous (+/-) and knockout mice (-/-). (A) Representative relative fluorescence intensity plots of ex vivo SCN for each of the VIP genotypes from LD (left) and DD (right) over 90 hours. (B) Representative normalized relative fluorescence intensity plots of individual neurons over 90 hours ex vivo. (C) Rayleigh plots from LD (left) and DD (right). Blue arrowheads represent the 50% peak rising phases of individual rhythmic neurons from a representative mouse of a particular genotype. Red arrow indicates the mean phase vector of rhythmic neurons, where length is inversely proportional to the neuronal phase variance, and the direction indicates timing relative to the previous light cycle in LD or previous behavioral cycles in DD. For LD (left), numbers indicate projected ZT, where projected ZT 0-12 is represented with a yellow background and projected ZT 12-24(0) is represented with a gray background; for DD (right), numbers indicate CT, where CT 0-12 is represented with a light gray background and CT 12-24(0) is represented with a darker gray background. For the VIP-/- mouse in DD, in which CT could not be reliably assigned, the phases of neurons are plotted as time ex vivo. (D) Neuronal phase variance in SCN from VIP+/+ (N = 4), VIP+/- (N = 5) and VIP-/- (N = 4) mice maintained in LD. (E) Neuronal phase variance in SCN from VIP+/+ (N = 7), VIP+/- (N = 8) and VIP-/- (N = 7) mice maintained in DD. (F) SCN phase from VIP+/+ (N = 9), VIP+/- (N = 9) and VIP-/- (N = 6) mice previously maintained in LD. Error bars represent SEM; asterisks (*) represent significance at p < 0.05.
