Figure 2.
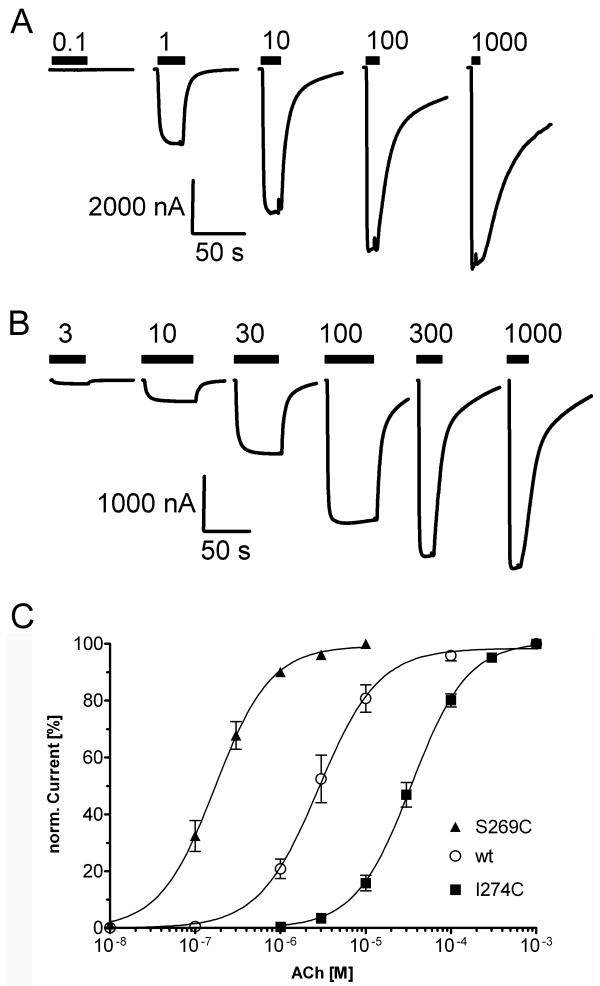
ACh concentration-response curves of wildtype and mutant αβγδ nAChR. Representative current traces for A, wildtype and B, mutant αI274Cβγδ receptors upon increasing ACh concentrations are shown. Application of ACh is indicated by black bars above the current traces, ACh concentrations in μM are given above bars. C, ACh concentration–response curves from oocytes expressing αβγδ wildtype (○), αS269Cβγδ (▲), or αI274Cβγδ (■) receptors. Currents were normalized to the maximum current for each oocyte. Data points represent the mean ± SEM from three to four independent experiments. Data were fit by nonlinear regression analysis as described in Materials and Methods. ACh EC50 and nH values are reported in Table 1.

