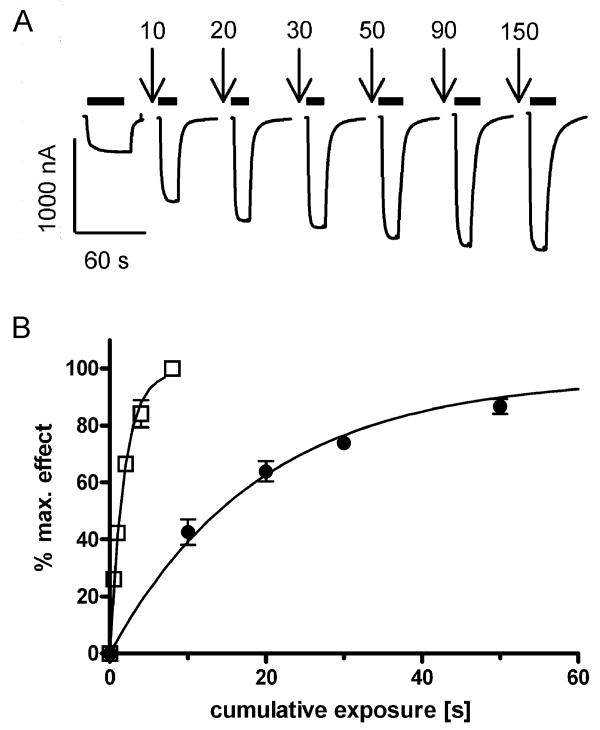
Figure 4.
Rate constants for MTSEA modification. A, Representative ACh induced current traces recorded before and after successive MTSEA applications (100 μM, indicated by downward arrows, cumulative application time in sec) for αT267Cβγδ receptors. Time of ACh test pulse application indicated by black bars. B, Fractional effect for αT267Cβγδ was normalized to the maximum effect for each individual oocyte and plotted versus the cumulative exposure time of MTSEA alone (●), and of MTSEA co-applied with ACh (□). Data points represent the mean ± SEM from three to four independent experiments. Note that for some data points the error bars are smaller than the symbol and therefore not visible. Data were fit by nonlinear regression analysis as described in Materials and Methods. Second-order rate constants are reported in Table 2.

