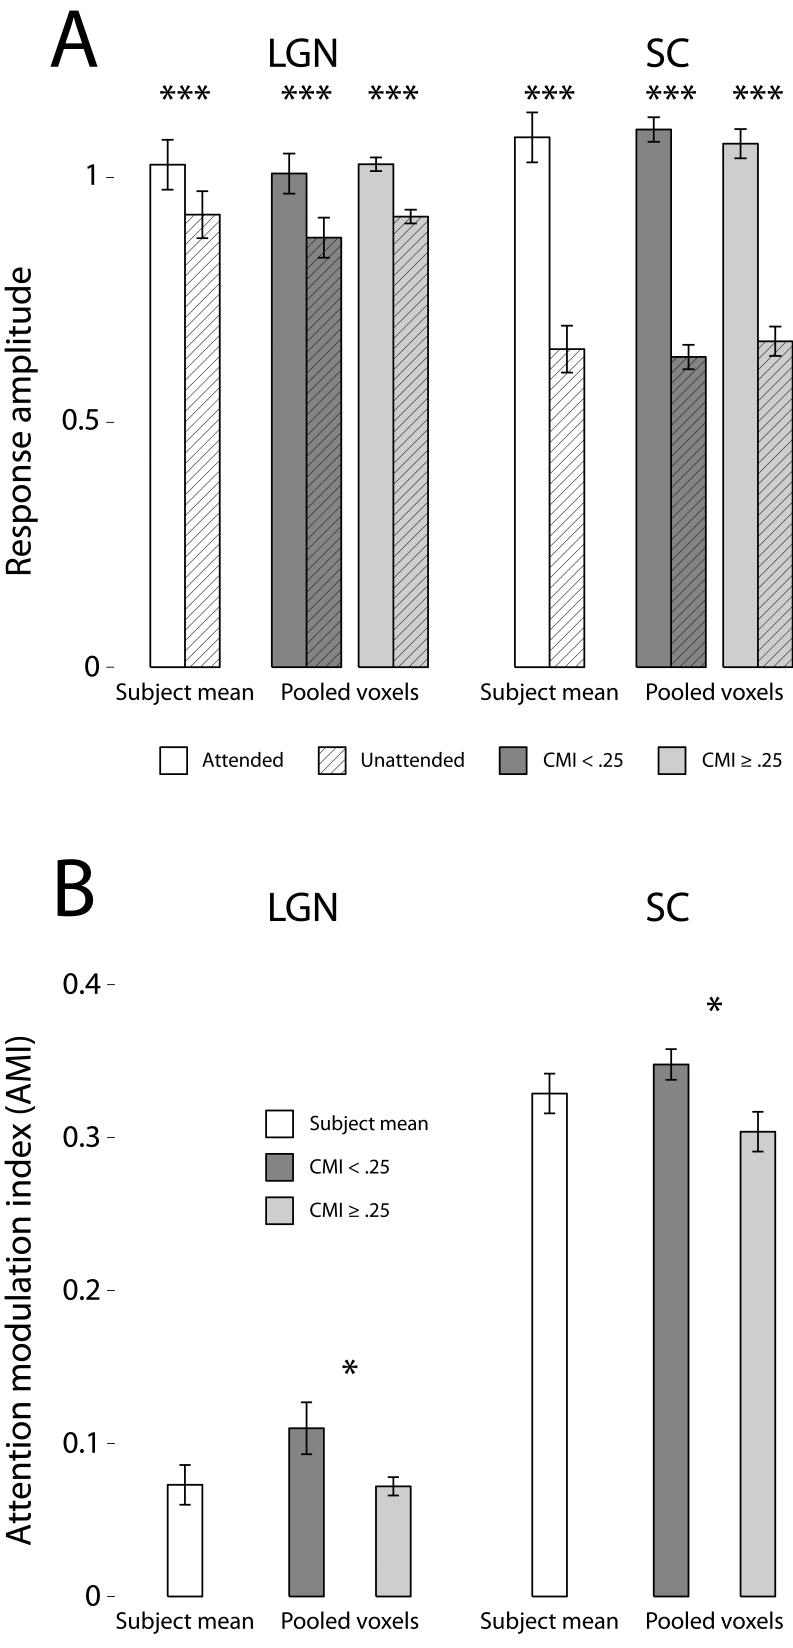
Figure 4. Effects of attention in the LGN and SC.
A. The response amplitudes evoked by the dot motion and color/shape stimuli are shown for the LGN and SC. The amplitudes for the attended (white bars) and unattended (hatched bars) conditions are shown averaged across subjects; error bars indicate the standard error of the mean (SEM). The shaded bars show the same data pooled over all voxels and sorted into two different groups: voxels with contrast modulation indices (CMI) < .25 (darker bars) and voxels with CMI ≥ .25 (lighter bars). The hatched bars correspond to the unattended conditions; the unhatched bars correspond to the attended conditions. Significant differences in paired comparisons are marked with asterisks, * for p < .05 and *** for p < .001. B. Attention modulation indices (AMI) are shown for the LGN and SC either averaged by subject (white bars) or voxels grouped by CMI (shaded bars).

