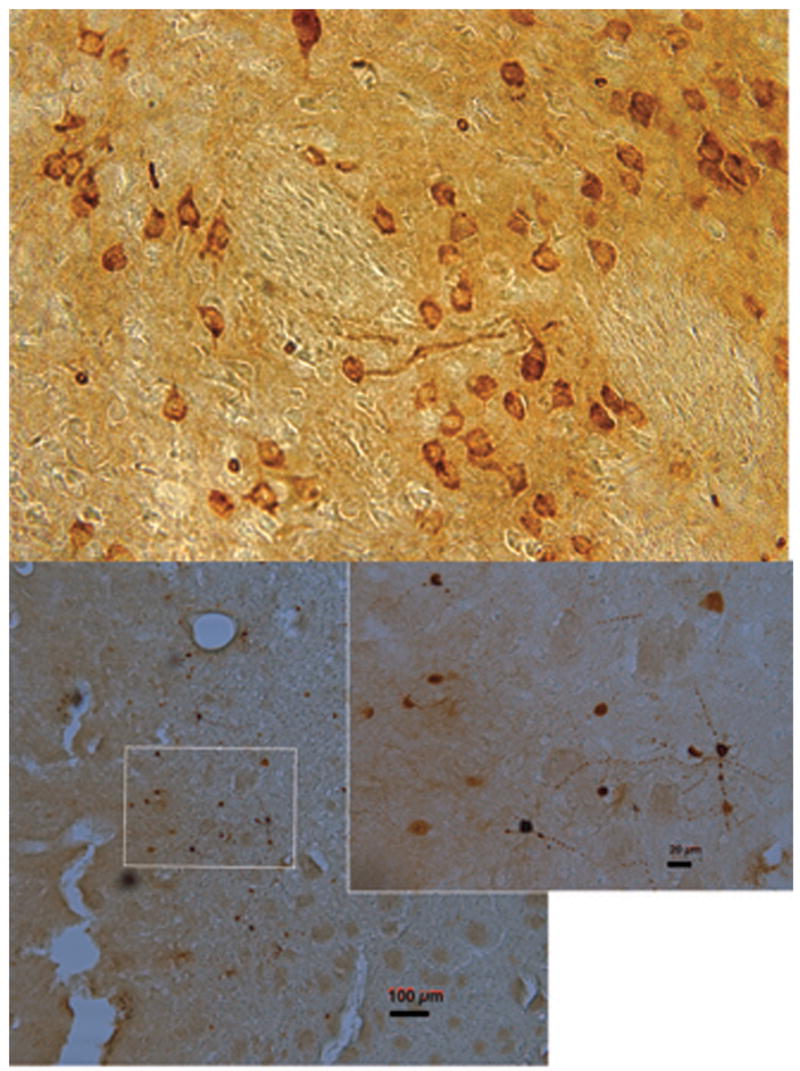
Figure 4.

Expression of ERα (top) and green fluorescent protein (GFP; bottom) in striatum after adeno-associated viral vector injection. Top is a representative image from an animal in the behavioral study. The bottom image is from an animal in the dialysis study, inset depicts cells with expression of GFP adjacent to the track. Magnification 40X, calibration bar lower right is 100 μm; and in inset 20 μm.
