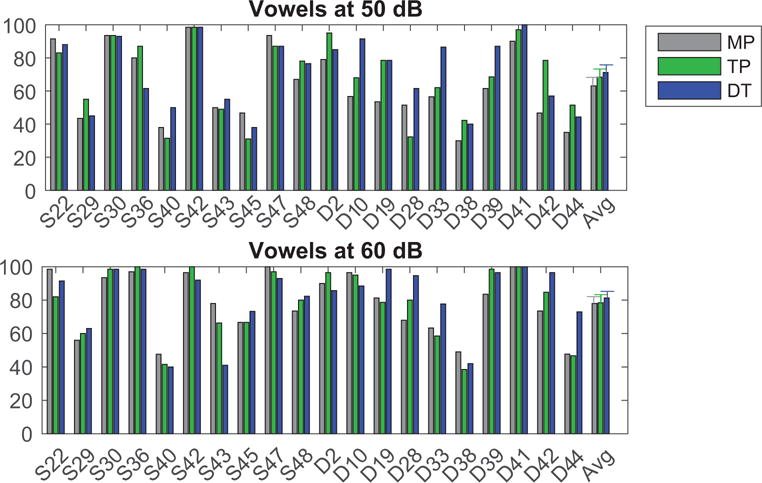
Figure 2.

Performance (as % correct) is plotted for MP (grey), TP (green), and DT (blue) strategies for vowel identification when stimuli were presented at 50 (top) and 60 (bottom) dB SPL equivalent. The right most set of bars represent the average data and error bars represent the standard error of the mean.
