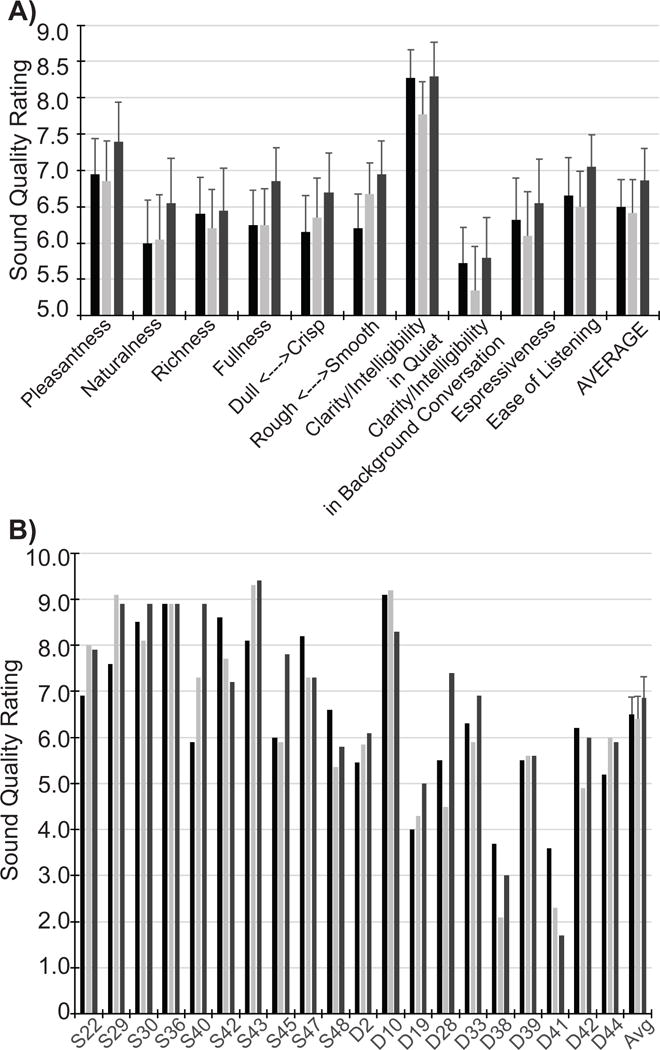
Figure 4.

A) Each bar height indicates the sound quality rating (qualities label the x-axis) averaged across listeners for MP (black), TP (light grey) and DT (dark grey). The average of sound qualities across listeners is shown in the right-most set of bars. B) Each bar height indicates the sound quality ratings averaged across sound qualities for individual subjects (labeled along the x-axis). Error bars represent standard error of the means.
