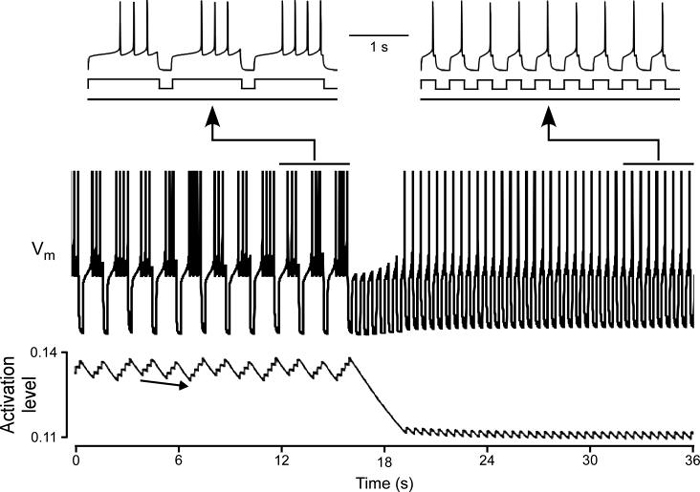
Figure 9.
Changes of mean slow potassium current activation explain changes in slow potassium model activity when stimulation pattern changes. Top two traces: model activity and stimulation pattern at steady state before (left) and after (right) stimulation pattern change on an expanded time scale. Third trace: model activity at a slow time scale (plot x axis). Plot: slow potassium conductance activation level on same time scale as third trace. Stimulation pattern change occurred (approximate time 16.5 s) when neuron stopped firing (third trace) and activation level began large decline (plot). When the stimulation pattern had a long uptime and short downtime, the activation of the slow potassium current was high, and model rebound delay was therefore long (left). For explanation of long-term variation in burst spike number (arrow) see Results. When uptime was decreased, the slow potassium current's activation level decreased to a lower steady-state level at which model rebound delay was shorter (right). Immediately after the pattern change the model could not fire because rebound delay was longer than uptime. `Activation level' refers to the value of parameter `a' in the equation for IK (see Appendix), which can vary from 0 (no activation) to 1 (full activation).

