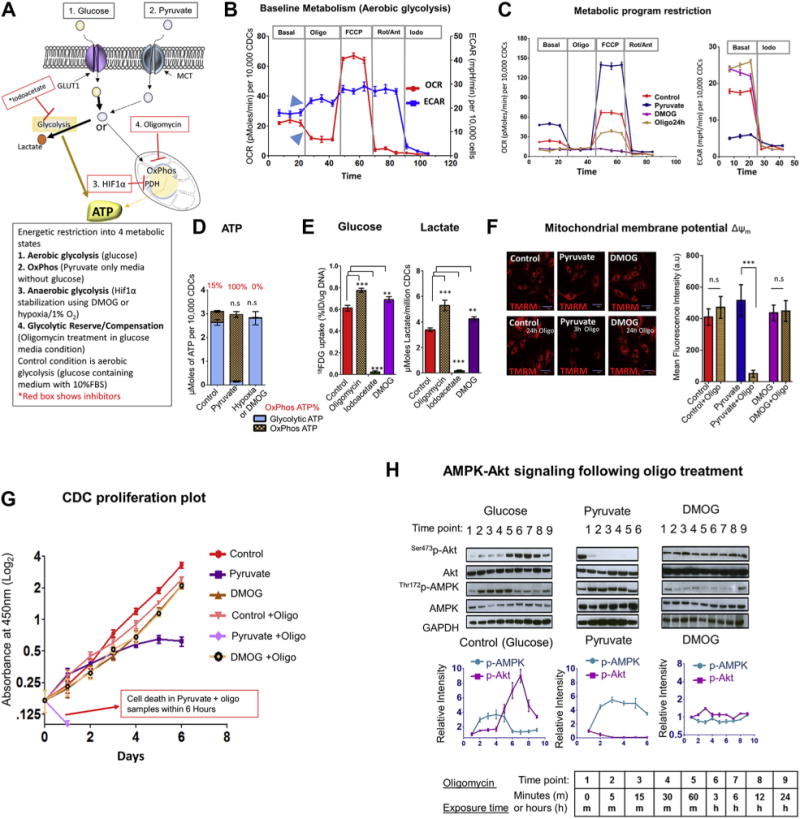
FIGURE 1. Metabolic Restriction in CDCs Reveals Presence of Glycolytic Reserve.

(A) Schematic of study design. Glucose is transported into cells via glucose transporter 1 (GLUT1), and is metabolized by glycolysis to generate pyruvate, most of which is converted to lactate in proliferating cells. Iodoacetate (iodo) inhibits the glycolytic enzyme, glyceraldehyde-3-phosphate dehydrogenase (GAPDH). Pyruvate enters cells via the mono-carboxylate transporter (MCT) and is metabolized to lactate or acetyl-CoA by the pyruvate dehydrogenase complex (PDH), which is inhibited by HIF-1α. Pyruvate fuels oxidative phosphorylation (OxPhos) NRV, which is inhibited by oligomycin (oligo). (B) Representative respirometry data from cardiosphere-derived cells (CDCs) cultured in serum and glucose-containing medium. Inhibitors of the mitochondrial electron transport chain (oligo, rotenone, antimycin A) suppressed oxygen consumption rate (OCR) and led to compensatory increase in glycolysis (extracellular acidification rate [ECAR]), indicated by blue arrowheads. FCCP, a protonophore that uncouples OxPhos, was used to quantify OxPhos capacity. Data is presented as mean ± SEM; n = 6. Significance was determined by 1-way analysis of variance (ANOVA)followed by Tukey’s post-hoc test. (C) Restriction of metabolic program in CDCs to OxPhos (pyruvate), anaerobic glycolysis (DMOG), or aerobic glycolysis (control) reveals highest OxPhos capacity in pyruvate medium. ECAR was similar during anaerobic glycolysis and following inhibition of OxPhos by oligo for 24 h, during aerobic glycolysis. Data is presented as mean ±SEM; n = 6. Significance was determined by 1-way ANOVA followed by Tukey’s post-hoc test. (D) Oligo-sensitive ATP. OxPhos inhibition for 30 to 45 min led to reduction in cellular ATP of 15% in glucose medium, 100% in pyruvate medium, and 0% in DMOG medium. Statistical significance is presented for total ATP levels (compared with control) and calculated using the unpaired Student t test. (E) OxPhos inhibition by oligo led to an increase in glucose (18FDG) uptake and lactate generation in glucose medium. Iodo treatment significantly suppressed both glucose uptake and lactate generation, whereas HIF-1α stabilization by DMOG significantly increased glucose uptake and lactate generation by CDCs. The Student t test was used to determine significance. (F) Mitochondrial membrane potential. ΔΨm is maintained following inhibition of OxPhos for 24 h during aerobic glycolysis (control) and anaerobic glycolysis (DMOG). Oligo induces ΔΨm depolarization within 3 h in pyruvate medium. The Student t test was used to determine significance. (G) Cell proliferation assay. CDC proliferation continues, but at a reduced rate following oligo treatment during aerobic glycolysis. Cell proliferation ceases on days 2 to 3 in pyruvate medium and oligo leads to cell death within 1 day in pyruvate medium. CDCs proliferate during anaerobic glycolysis (DMOG), but at a reduced rate when compared with aerobic glycolysis (control). Oligo treatment has no effect on proliferation during anaerobic glycolysis. A 2-way ANOVA with repeated measure was used to evaluate differences between groups over time. (H) Time course of Akt and AMPK activation following OxPhosinhibition by oligo during aerobic glycolysis, anaerobic glycolysis, and OxPhos. Akt activationat 1 h following oligo treatment during aerobic glycolysis (control) is associated with reduction in AMPK phosphorylation, indicating reduction of energetic stress. Akt dephosphorylation and persistent AMPK activation is observed following inhibition of OxPhos in pyruvate medium. Oligo had little effect on AMPK and Akt signaling during anaerobic glycolysis (DMOG); (n = 3 for each time point. Results are presented as mean ± SD; n = 6 in each run; each experiment was repeated 3 times unless otherwise specified. **p < 0.01; ***p < 0.001. n.s. = nonsignificant.
