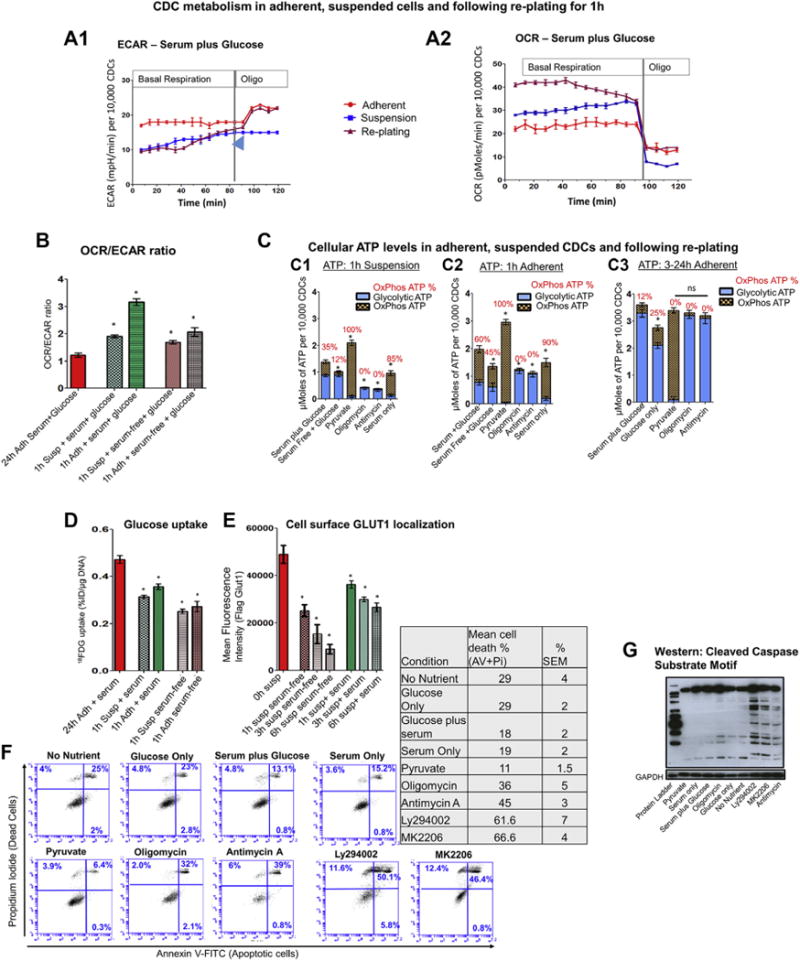
FIGURE 5. Cell Suspension Leads to Energetic Stress Due to Nutrient Limitation.

(A1 and A2) Live respirometry in 24-h adherent, suspended, and replated CDCs. Adherent cells have higher glycolysis (ECAR) than suspended cells and re-plated cells. Cells in suspension and immediately following replating have higher OxPhos than cells adherent for 24 h. ECAR is restored within 60 to 90 min following replating. Cells in suspension do not exhibit increase in ECAR following oligo treatment, indicating a loss of glycolytic reserve (blue arrowhead). Data is presented as mean ± SEM with n = 4. Two-way repeated ANOVA followed by Tukey’s post-hoc test was used to compare respirometry data in the 3 groups. (B) OCR/ECAR ratio. Cell suspension and early replating are associated with significant increase in the OCR/ECAR ratio, due to a greater increase in OCR than ECAR when compared with cells adherent for 24 h. The Student t test was used to compare each condition, with results from 24-h adherent cells cultured in the presence of serum/glucose-containing medium (control). (C) Energetics. Suspension (C1) leads to a reduction in cellular ATP levels and increase in ATP generation by OxPhos, when compared with cells adherent for 3 to 24 h (C3). Replacing glucose with pyruvate results in the highest ATP levels in suspended cells and early during early replating (C2), but ATP levels are still lower than cells adherent for 3 to 24h (C3). Cells fail to increase glycolytic ATP following inhibition of OxPhos by oligo in suspension, indicating loss of glycolytic reserve. Early replating (C2) increases ATP generation by OxPhos, but cellular ATP levels are lower than in cells adherent for 3 to 24 h. Statistical comparison for total ATP levels were performed using the Student t test. (D) Glucose (18FDG) uptake. Cells in suspension and following replating demonstrate lower glucose uptake than cells adherent for 24 h. Statistical comparison was performed with glucose uptake by CDCs adherent for 24 h, using the Student t test. (E) Cell surface GLUT1 localization. Cell surface GLUT1 localization is significantly reduced within 1 h of suspension. Longer periods of suspension (3 to 6 h) leads to a progressive reduction of cell surface GLUT1 localization. GLUT1 levels were measured immediately following trypsinization, which is indicated as the 0-h time point, to control for the effect of trypsinization/cell harvesting on cell surface expression of GLUT1. Statistical comparison was performed with cell surface FLAG-GLUT1 at 0 h suspension using the Student t test. (F) Flow cytometry using Annexin V and PI. Replacing glucose by pyruvate or serum in cell suspensions reduces cell death at 1 h of suspension. In contrast, OxPhos inhibition by oligo, antimycin A, or inhibition of PI3K-Akt signaling markedly increased cell death in suspension (n = 3; each experiment was repeated twice). (G) Western blot. Caspage cleavage was used to confirm cell death in suspended cells in different treatment conditions; n = 2; 1 representative image is shown Results and presented as mean ± SD; n = 6. Each experiment was repeated 3 times unless otherwise specified. *p < 0.05. Abbreviations as in Figure 1.
