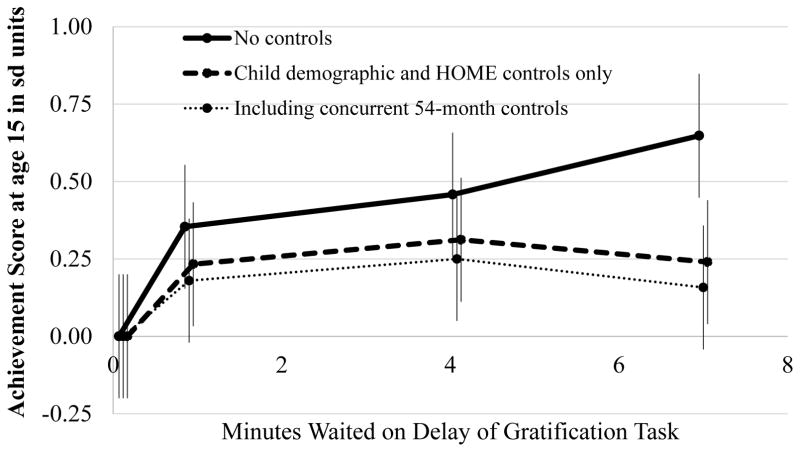
Figure 1. Predicted Achievement Scores by Minutes of Delay for Children of Mothers With No College Degree.
Note. Error bars represent 95% confidence intervals. For each of the 4 discrete groups described in the note of Table 2, we graphed the deviation in achievement composite scores from the reference group (delay <20 seconds) against the within-group average amount of time waited on the x-axis. The average wait times for the “No Controls” and “Child Demographic and HOME Controls Only” groups are displaced by ±.025 to distinguish the sets of error bars. The “High Delay” group’s coefficients are plotted at 7 minutes, although the 7-minute truncation prevents us from knowing what the mean value of minutes waited would have been for this group in the absence of the 7-minute limit.

