
Figure 4. Alterations in binding when chromatin landscaped is modified.
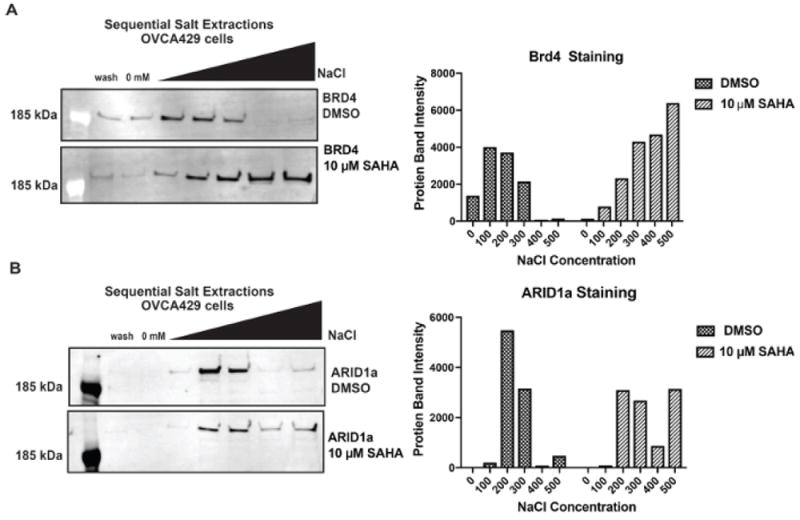
A) Comparison of BRD4 elution from OVCA429 cells treated with 10 μM SAHA for 3 hours compared to DMSO treatment. B) Elution profiles of ARID1a from OVCA429 cells treated with10 μM SAHA compared to DMSO. Band intensity is indicated for 0 mM - 500 mM fraction with DMSO or SAHA. Please click here to view a larger version of this figure.