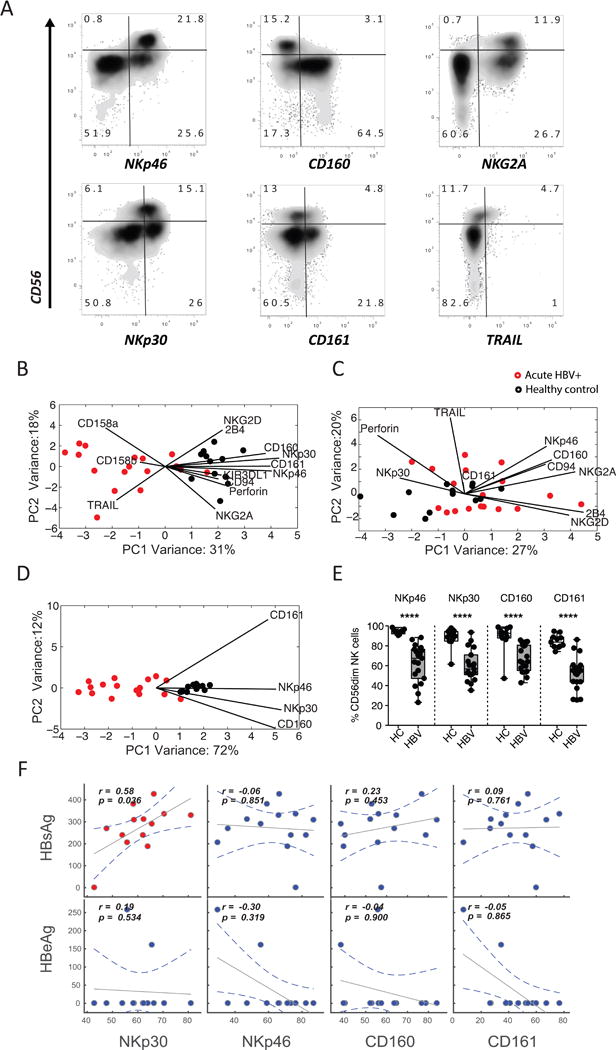
Figure 1. Distinct NK-cell profiles exist among healthy controls and HBV-infected individuals.

(A) Flow plots depict the expression of a number of candidate receptors on NK-cell populations in a representative candidate in the cohort, displaying discrete separation in CD3-CD56+CD16+/− NK cells. (B-C) The score plots of the principle component analysis for CD56dim NK cells (B) and CD56bright NK cells (C) from both healthy controls (black) and HBV-infected individuals (red) were built based on all immunophenotyping features. The contribution of the features to group separation were visualized by the lines in the plots, where the length of the line is proportional to how important that feature is to pulling data in its direction. (D) To further avoid over-fitting, caused by correlated changes in NK-cell markers, a second PCA was performed on CD56dim NK cells using the most significantly altered features. (E) Pairwise comparison of the 4 top features, on CD56dim NK cells, were compared in a univariate analysis. (F) Finally, spearman correlations between HBsAg/HBeAg levels and NKp30, NKp46, CD160, and CD161 levels on CD56dim NK cells show the relationship between these markers and HBV antigen load in HBV-infected individuals.
