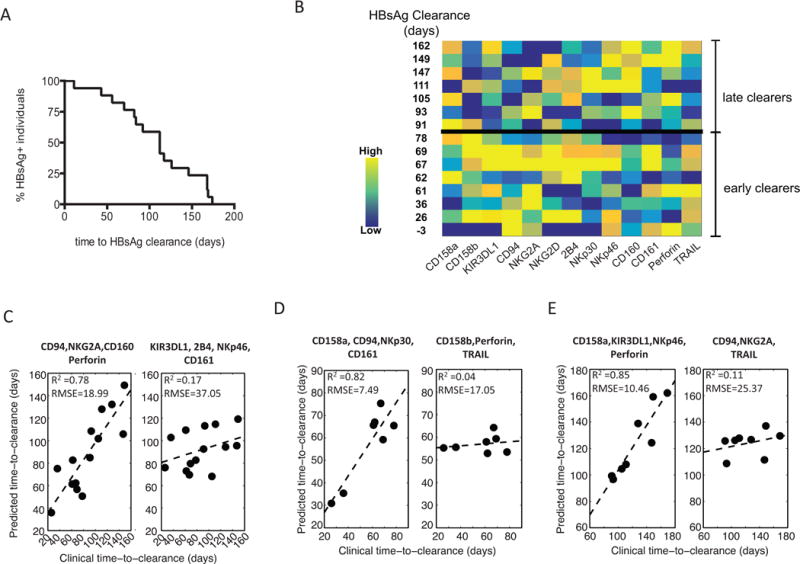
Figure 2. Predictions of time-to-HBV clearance using NK-cell profiles.

(A) A Kaplan–Meier survival curve depicts the time to HBsAg clearance across all HBV-infected individuals, demonstrating a broad range of clearance rates. (B) The acute CD56dim NK-cell marker profile with the corresponding time to clearance of HBsAg. (C-E) A PLSR-predicted time-to-clearance, after feature reduction, was performed (C) across the complete HBV+ cohort, (D) early clearers and (E) late clearers (early versus late were separated by the median time-to-clearance, 83 days). For each group the robustness of model prediction, presented as R-squared and root-mean-square-error (RMSE), was evaluated between the best set of the variables (left panel) versus randomly selected variables (right panel).
