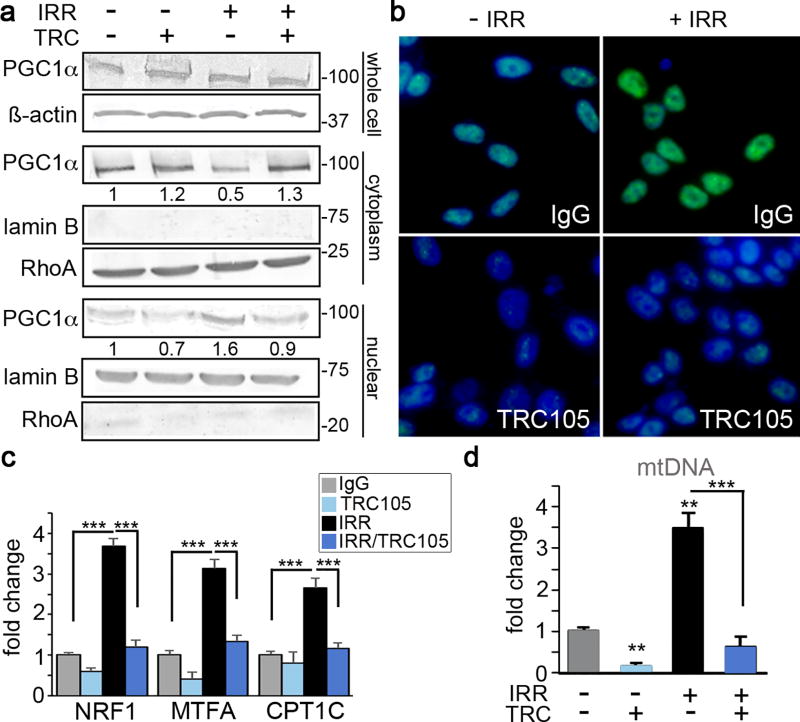
Figure 4. PGC-1α and mitochondrial biogenesis are regulated by CD105/BMP.
22Rv1 cells were incubated with IgG or TRC105 with or without 4 Gy irradiation. All measurements were made 72 hours post-irradiation. a. Western blot for whole cell lysate, nuclear and cytoplasmic fractions were independently analyzed for PGC-1α expression. Loading controls included β-actin (whole cell), lamin B (nuclear marker), and Rho A (cytoplasm marker). Molecular weights (kDa) of the ladder are indicated. b. Immunofluorescent localization of PGC-1α (green) was visualized with DAPI (blue) nuclear counterstain. c. The mRNA expression of PGC-1α target genes, NRF1, MTFA, and CPT1C were measured. MRNA expression was normalized to GAPDH and untreated. d. Mitochondrial DNA (mtDNA) was measured from total DNA extracts and normalized to nuclear DNA and to untreated. Data are reported as means +/− S.D. of 3 independent experiments. (*p < 0.05, **p < 0.01, ***p < 0.001, compared to control unless otherwise indicated).

