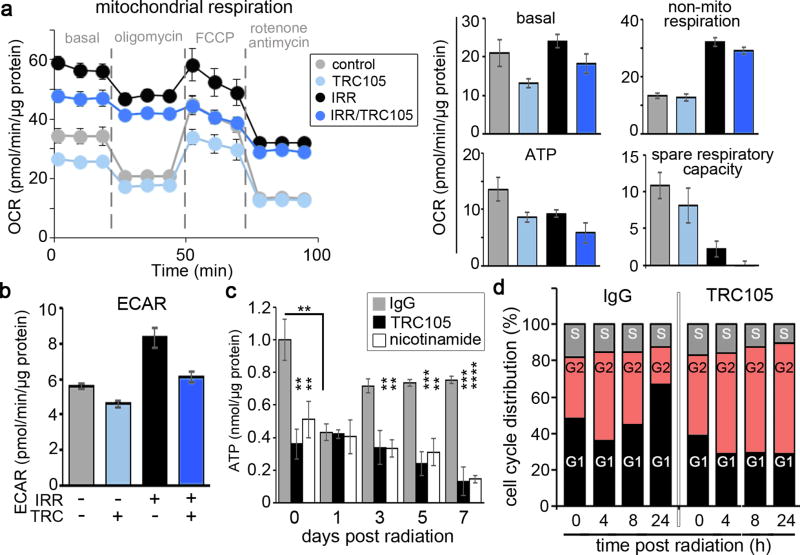
Figure 5. Metabolic changes induced by CD105 antagonism.
a, b. Cells were analyzed for mitochondrial activity 168 hours following 4 Gy irradiation in the presence of IgG or TRC105. a. Basal respiration, non-mitochondrial respiration, mitochondrial ATP, spare respiratory capacity, and b. extracellular acidification rate were quantitated. Data are reported as mean +/− S.D. of a representative experiment (n = 5) of 3 independent experiments. c. Total cellular ATP was measured 0, 24, 72, 120, and 168 hours following 4 Gy irradiation in the context of IgG, TRC105 or nicotinamide treatment. Data are reported as mean +/− S.D. of 3 independent experiments. (**p < 0.01, ***p < 0.001, ****p < 0.0001). d. Cell cycle analysis was performed on 22Rv1 at 0, 4, 8, and 24 hours post-irradiation in the presence of IgG or TRC105 (n=3) in 3 independent experiments.

