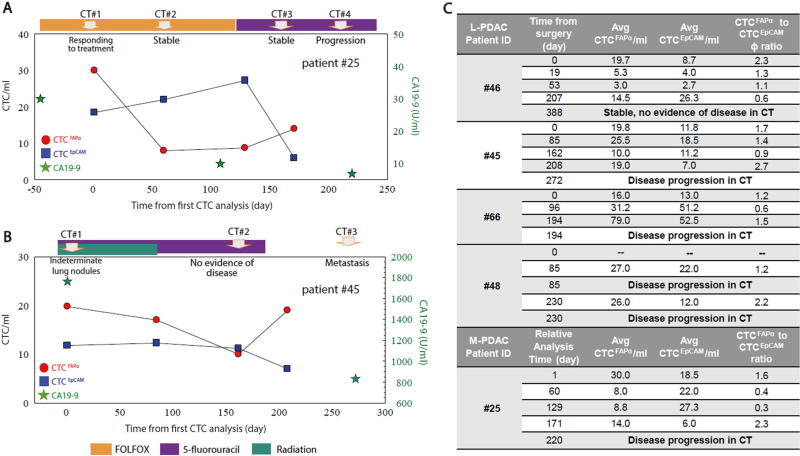
Fig. 4.
Longitudinal tracking of CTCFAPα and CTCEpCAM numbers in the blood of PDAC patients. a M-PDAC patient #25. The first CTC analysis was performed during second-line therapy (t = 0). b L-PDAC patient #45. The first CTC analysis in this case was performed pre-operatively on the day of surgery (t = 0). CA19-9 measurements (green stars) are shown when available. CTCFAPα = red dots, and CTCEpCAM = blue squares. Points are connected for ease of visualization, but do not represent any type of functional relationship between the individual data points. c A summary of all patients tested in this longitudinal study

