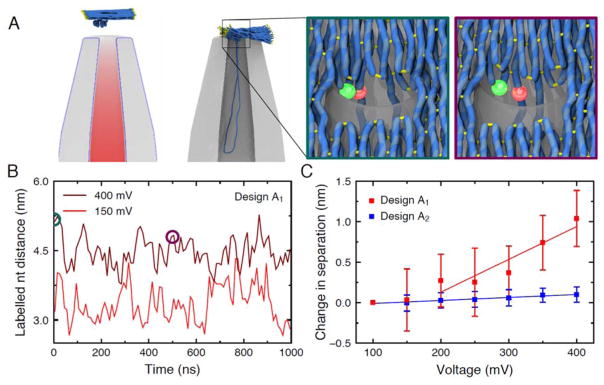
Figure 2.
Coarse-grained Brownian dynamics simulations of the origami plate capture. A left, A typical simulation system. Electrostatic potential around the nanocapillary, due to a 400 mV applied bias, is superimposed with the initial configuration of the plate described using a low-resolution (5 base pairs per bead) coarse-grained model. The configuration after 40 μs of simulation is shown to the right. Part of the nanocapillary is cut away for clarity. A high-resolution model of the plate (2 base pairs per bead) was used in subsequent simulations to measure the distance between the labelled nucleotides. The inset outlined in teal (left) shows the initial configuration of one such model under a 400 mV bias. The inset outlined in purple (right) shows the same model after a 500 ns simulation. Here, the side-by-side FRET pair of design A1 is shown, but similar simulations were used to estimate distances for both FRET pairs. B The distance between the labelled nucleotides during simulations of the high-resolution coarse-grained models at low (red) and high (dark red) applied biases for design A1. The circles indicate the states featured in panel A. C The distance between labelled nucleotides averaged over five simulations for each applied bias, relative to the distance obtained at 100 mV. The average distance between the nucleotides was obtained in each simulation, and the mean and standard error of the mean of the five distance values were calculated at each bias. The bars show the propagation of these errors for the difference of the distances. The lines show linear fits to the data.

