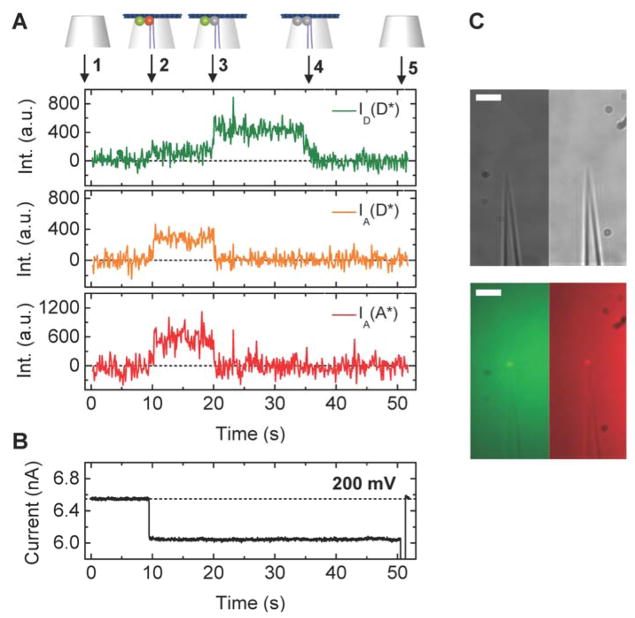
Figure 3.
A Representative examples of fluorescence intensity traces correlated with voltage and ionic current recordings for DNA origami plates with design A1. A (top) Trace annotations: 1 Bare nanocapillary. 2 DNA origami trapping. 3 Acceptor bleaching. 4 Donor bleaching. 5 DNA origami ejection. (bottom) Fluorescence intensity ID(D*), IA(D*), IA(A*) traces. B Ionic current traces, please note that during these measurements the voltage was held constant at 200 mV until t = 50 s when the structure is removed by applying a brief voltage fluctuation from + to −1000 mV. C Brightfield (top) and fluorescence (bottom) images of a FRET pair labelled origami immobilised at the capillary tip, in the donor (left) and acceptor (right) emission channels. Scale bar 5 μm.

