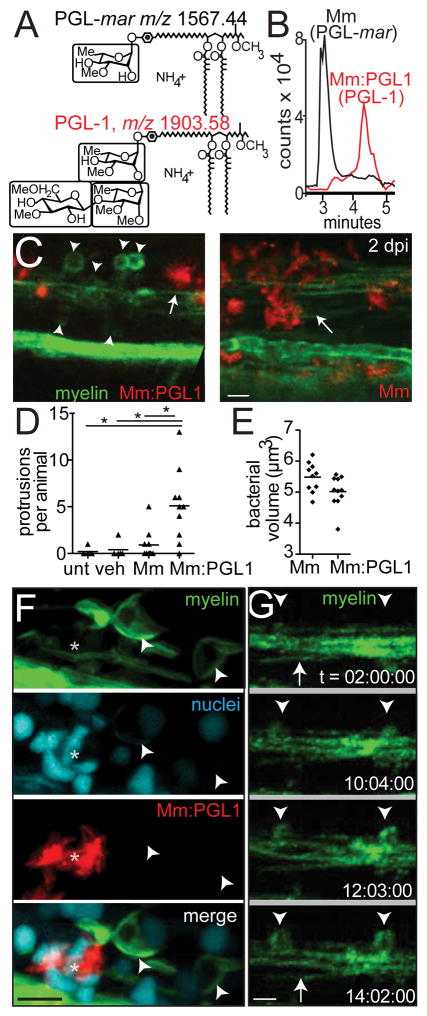
Figure 3. Phenolic glycolipid-1 triggers myelin dissociation.
(A) Normal phase high performance liquid chromatography mass spectrometry measured at the known mass-to-charge ratios (m/z) for triglycosylated and monoglycosylated forms of PGL, leading to the separate detection of PGL-mar (m/z 1567.44, upper structure) and PGL-1 (m/z 1903.58, lower structure) in total lipid extracts of the indicated strains (B).
(B) Chromatograms of the ions depicted in A, showing the increased retention time of PGL-1 from Mm:PGL1 compared to that of PGL-mar from wildtype Mm.
(C) Representative confocal images, as in Figure 2C, of 2 dpi (4 dpf) larvae infected with ~200 CFU Mm or Mm:PGL-1; myelin protrusions quantified in D. 10μm bar.
(D) Mean number of myelin protrusions per animal in uninjected larvae (unt), or after injection with PBS vehicle (veh), Mm, or Mm:PGL1 (~200 CFU each; (*p<0.05, one-way ANOVA with Bonferroni’s post-test).
(E) Mean bacterial burden at the injection site of larvae from D.
(F) Representative confocal image of a 6 dpf larva with fluorescently-labeled nuclei, 4 dpi with Mm:PGL1 (~100 CFU). Asterisk indicates an aggregate of infected cells. 10μm bar.
(G) Stills from time lapse imaging of an mbp larva injected with Mm:PGL1, showing myelin protrusions forming from apparently intact myelin. Arrow, intact myelin sheath; arrowheads, myelin protrusions. Relative timecode; 10μm bar.

