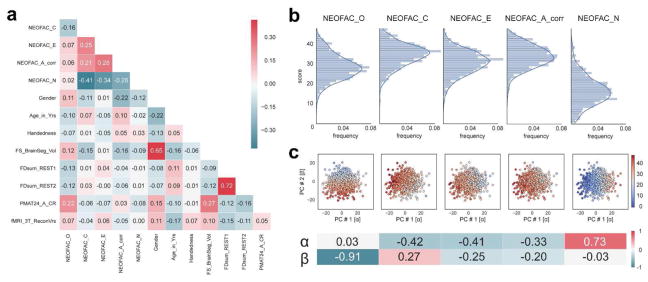
Figure 2. Structure of Personality factors in our subject sample (N=884).
a. The five personality factors were not orthogonal in our sample. Neuroticism was anticorrelated with Conscientiousness, Extraversion and Agreeableness, and the latter three were positively correlated with each other. Openness correlated more weakly with other factors. There were highly significant correlations with other behavioral and demographic variables, which we accounted for in our subsequent analyses by regressing them out of the personality scores (see next section). b. Distributions of the five personality scores in our sample. Each of the five personality scores was approximately normally distributed by visual inspection. c. Two-dimensional principal component projection; the value for each personality factor in this projection is represented by the color of the dots. The weights for each personality factor are shown at the bottom.

