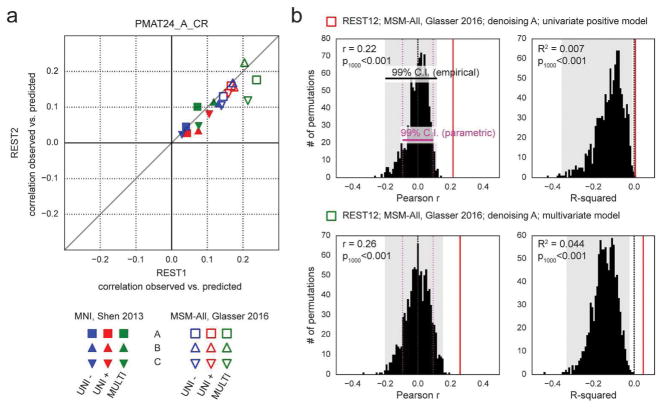
Figure 4. Prediction results for de-confounded fluid intelligence (PMAT24_A_CR).
a. All predictions were assessed using the correlation between the observed scores (the actual scores of the subjects) and the predicted scores. This correlation obtained using the REST2 dataset was plotted against the correlation from the REST1 dataset, to assess test-retest reliability of the prediction outcome. Results in MSM-All space outperformed results in MNI space. The multivariate model slightly outperformed the univariate models (positive and negative). Our results generally showed good test-retest reliability across sessions, although REST1 tended to produce slightly better predictions than REST2. Pearson correlation scores for the predictions are listed in Table 1. Supplementary Figure 1 shows prediction scores with minimal deconfounding. b. We ran a final prediction using combined data from all resting-state runs (REST12), in MSM-All space with denoising strategy A (results are shown as vertical red lines). We randomly shuffled the PMAT24_A_CR scores 1000 times while keeping everything else the same, for the univariate model (positive, top) and the multivariate model (bottom). The distribution of prediction scores (Pearson r, and R2) under the null hypothesis is shown (black histograms). Note that the empirical 99% confidence interval (shaded gray area) is wider than the parametric CI (shown for reference, magenta dotted lines), and features a heavy tail on the left side for the univariate model. This demonstrates that parametric statistics are not appropriate in the context of cross-validation. Such permutation testing may be computationally prohibitive for more complex models, yet since the chance distribution is model-dependent, it must be performed for statistical assessment.

