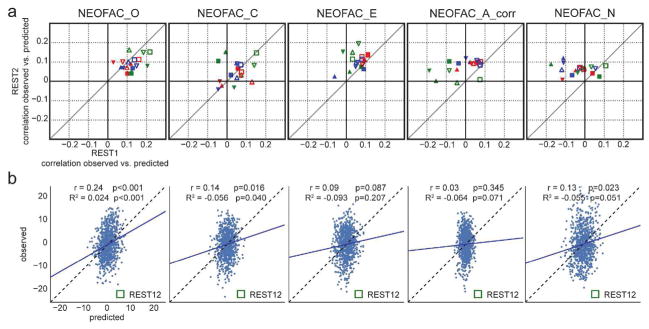
Figure 5. Prediction results for the Big Five personality factors.
a. Test-retest prediction results for each of the Big Five. Representation is the same as in Figure 4a. The only factor that showed consistency across parcellation schemes, denoising strategies, models and sessions was Openness (NEOFAC_O), although Extraversion (NEOFAC_E) also showed substantial positive correlations. See also Table 1. b. Prediction results for each of the (demeaned and deconfounded) Big Five, from REST12 FC matrices, using MSM-All inter-subject alignment, denoising strategy A, and the multivariate prediction model. The blue line shows the best fit to the cloud of points (its slope should be close to 1 (dotted line) for good predictions, see Piñeiro et al., 2008). The variance of predicted values is noticeably smaller than the variance of observed values.

