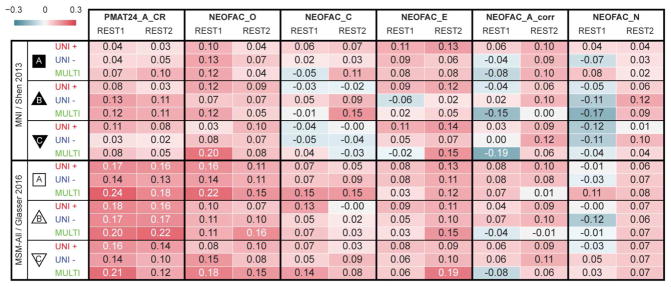
Table 1. Test-retest prediction results using deconfounded scores.
Listed are Pearson correlation coefficients between predicted and observed individual scores, for all behavioral scores and analytical alternatives (the two columns for each score correspond to the two resting-state sessions). See Supplementary Figure 1 for results with minimal deconfounding.

