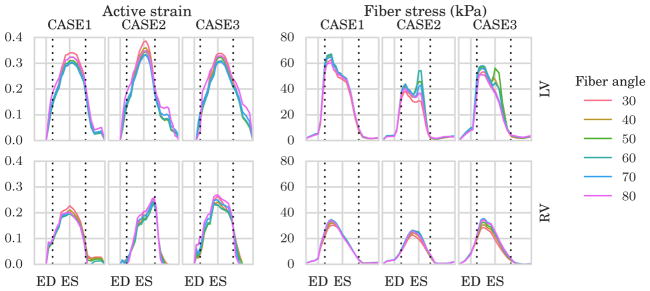
FIGURE 5.
To the left, average traces of the active strain parameter γ in (3) in the left ventricle (LV, top) and right ventricle (RV, bottom) for different choice of fiber angle. To the right, average traces of Cauchy fiber stress in the LV (top) and RV (bottom) for different choice of fiber angle. The fiber angles were defined symmetrically across the wall with a negative angle on the epicardium and a positive angle on the endocardium ranging from 30° to 80° with increments of 10°. On the x–axis, we plot the normalized time with respect to end-diastole (ED) and end-systole (ES). Horizontal dotted lines indicate timings of opening of the aortic and mitral valve

