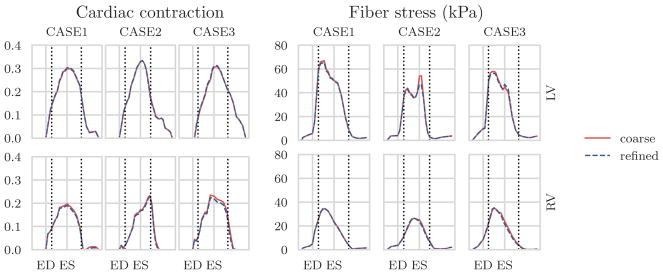
FIGURE 7.
Results obtained using different mesh resolutions as listed in Table 1. To the left and right, respectively, the active strain and fiber stress traces, in the left ventricle (LV, top) and right ventricle (RV, bottom) estimated using the coarse and refined geometry. ED, end-diastole; ES, end-systole

