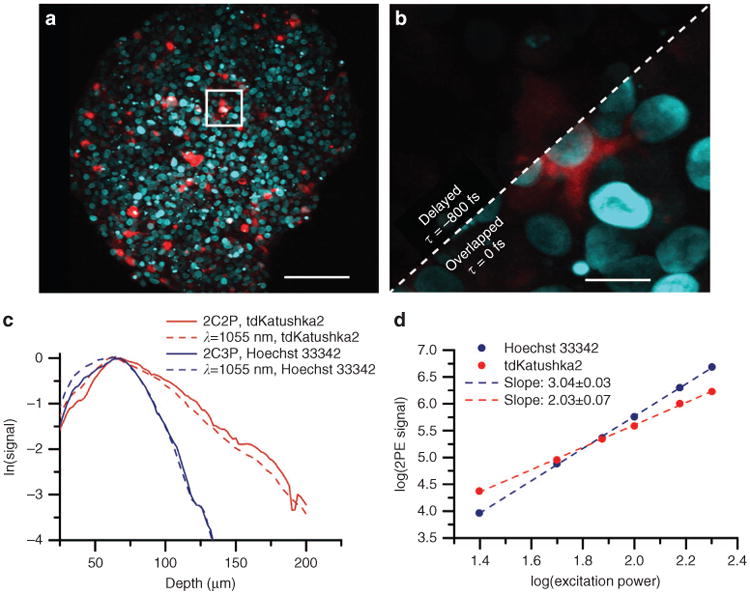
Figure 5.

Two-color three-photon excitation of spheroids (a) Maximum intensity projection of a 200 μm thick spheroid with MCF-10A cells expressing tdKatushka2 (red) in vasodilator-stimulated phosphoprotein (VASP), and nuclei labelled with Hoechst 33342 (blue). Scale bar is 80 μm. (b) A 10 μm thick maximum intensity projection at 100 μm depth. The image is a zoom in of the white boxed region from panel (a) showing the effect of pulse synchronization on signal. The scale bar is 10 μm. (c) Mean image signal level versus depth for both color channels, tdKatushka2 (red), and Hoechst33342 (blue), and both excitation regimes, two-color excitation (solid line), and fiber amplifier only (dashed line). (d) Signal dependence versus excitation power for Hoechst 33342 (blue), and tdKatushka2 (red), using two-color excitation. tdKatushka2 undergoes two-photon excitation, while Hoechst33342 undergoes two-color three-photon excitation.
