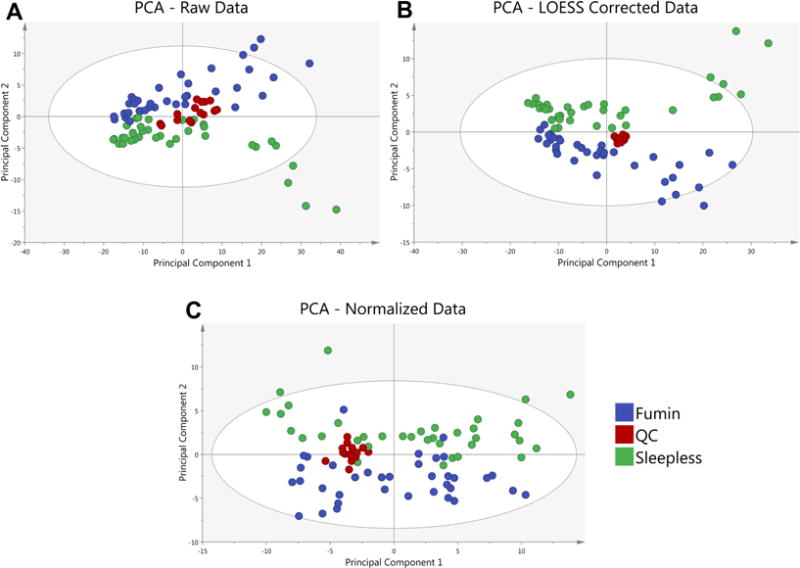
Figure 4. Principal Component Analysis (PCA) of a sample data set is shown.

A PCA of the average of 2 analytical replicates for 2 Drosophila genotypes (Fumin and Sleepless) shows the clustering of quality control (QC) samples at various steps in the data analysis process. QC samples (red) are shown prior to LOESS correction and Normalization (A) to exhibit a greater spread as compared to after LOESS Correction (B). QC samples remain tightly clustered after median fold change normalization of the LOESS corrected Data (C).
