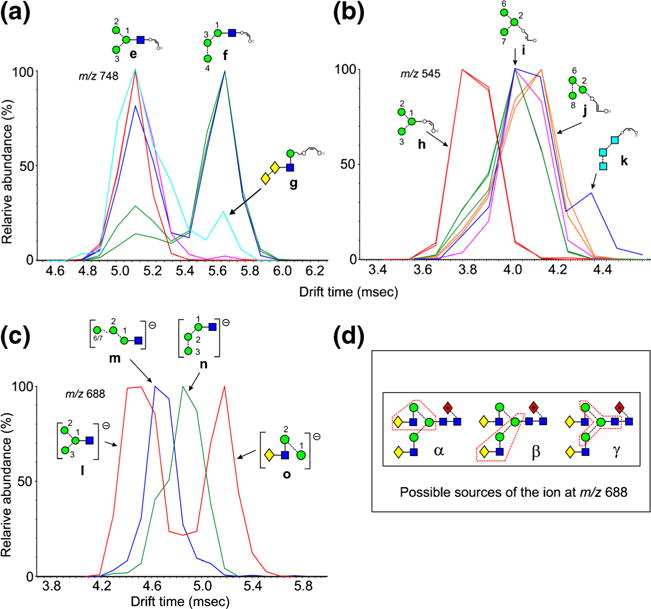
Figure 3.

Extracted fragment ATDs of Hex3-containing ions. (a) Fragments of composition Hex3GlcNAc1-O-CH=CH-O− (m/z 748). Red traces (ion e), extracted fragment ATDs from Man3GlcNAc2 (1), Pink trace, Ion e from Man5GlcNAc2 (2) and the complex and hybrid glycans. Blue trace, extracted fragment ATD from Man6GlcNAc2 (3), (ion f). Light blue trace, ion g from Gal2GlcNAc4Fuc1 (21). (b) Fragments of composition Hex3-O-CH=CH-O− (m/z 545). Green trace, ATD of ion h produced by Man5-7GlcNAc2 (2, 3, 4). Orange trace, ion I from glycans with at least mannose 4 in the 3-antenna. Pink trace, ATD from Glc1Man9GlcNAc3 (12). Red trace, ion g produced by Man3GlcNAc2 (1) and the complex glycans. Blue trace, second peak, ion k containing the three glucose residues (from Compound 14). (c) Ion l (red trace, first peak) arises from cleavage γ in panel 3d from the biantennary glycan and from Man3GlcNAc2 (1). The second peak of the red trace is ion o produced by cleavage α (panel 3d), also known as the diagnostic D ion. Ions m and n are produced by many of the hybrid and high-mannose glycans [e.g., blue trace from Man5GlcNAc2 (2), green trace (from Man9GlcNAc2 (9)] from glycans with mannose 4 in the 3-antenna). (d) Structure of the biantennary glycan Gal2Man3GlcNAc4Fuc1 (21) showing cleavages α, β, and γ leading to the fragment ion at m/z 688 enclosed in the red boxes
