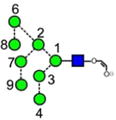
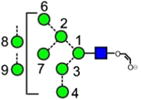
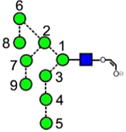
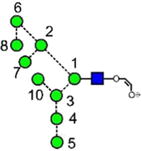
Table 1.
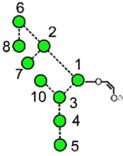
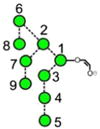
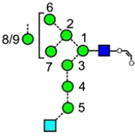
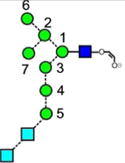
Structures, Masses, and Estimated nitrogen Traveling Wave Collisional Cross-Sections of the Fragment Ionsa

|
|

|

|

|

|

|
| a | b | c | d | e | f | g |
| 586.2 | 586.2 | 586.2 | 586.2 | 748.3 | 748.3 | 748.3 |
| 217.6 | 225.1 (0.0, n=2) |
227.6 | 224.4 | 245.3 (0.6, n = 14) |
259.2 (0.4, n=8) |
– |

|

|

|

|

|

|

|
| h | i | j | k | l | m | n |
| 545.2 | 545.2 | 545.2 | 545.2 | 688.2 | 688.2 | 688.2 |
| 207.7 | 215.0 (0.1, n = 5) |
215.9 (0.6, n = 6 | – | 229.8 (1.5, n = 3) |
234.3 (0.8, n = 7) |
240.7 (1.7, n = 8 |

|

|

|

|

|

|

|
| o | p | q | r | s | t | u |
| 688.2 | 910.3 | 910.3 | 910.3 | 910.3 | 910.3 | 910.3 |
| 247.0 | 274.2 (1.7, n = 8) |
– | – | 276.5 | 269.4 | 272.0 |

|

|

|

|

|

|

|
| v | w | x | y | z | aa | ab |
| 910.3 | 707.2 | 707.2 | 707.2 | 707.2 | 647.2 | 647.2 |
| 277.6 | 239.7 (0.9, n = 10) |
240.6 | 249.7 (0.4, n = 3) |
250.6 (0.3, n = 3) |
229.6 | 229.1 |

|

|

|

|

|

|

|
| ac | ad | ae | af | ag | ah | ai |
| 647.2 | 647.2 | 647.2 | 869.3 | 869.3 | 869.3 | 869.3 |
| 235.7 (0.6, n = 3) |
239.4 (0.2, n = 3) |
234.8 (0.7, n=3) |
– | 264.6 (0.0, n = 2) |
As ae | 263.2 |

|

|

|
|

|

|

|
| aj | ak | al | am | an | ao | ap |
| 869.3 | 869.3 | 869.3 | 1234.4 | 1234.4 | 1234.4 | 1031.3 |
| 270.0 | 272.3 (0.9, n = 8) |
276.0 (0.4, n = 3) |
323.6 (0.6, n = 4) |
326.5 (0.1, n = 2) |
335.3 (2.0, n = 2) |
293.2 (1.0, n = 9) |
|
|
|
|

|
|
|
| aq | ar | as | at | au | av | aw |
| 1031.3 | 1031.3 | 1558.5 | 1558.5 | 1558.5 | 1558.5 | 1720.6 |
| 293.6 (0.0, n = 3) |
301.3 (0.6, n = 2) |
367.9 | 377.0 | 382.7 (0.1, n = 3) | – | 401.7 396.7 (0.1, n = 4) |
|
|
|
|

|
|
|
| ax | ay | az | ba | bb | bc | bd |
| 1720.6 | 1517.5 | 1517.5 | 1720.6 | 1720.6 | 1720.6 | 1517.5 |
| 399.4 (0.3, n = 4) |
361.4 (0.1, n = 4) |
365.4 (0.1, n =4) |
399.9 (0.0, n = 3) | 405.1 (0.1, n = 3) |
– | 362.9 (0.1, n = 3) |
|
|
|

|

|

|
|
| be | bf | bg | bh | bi | bj | |
| 1882.6 | 1882.6 | 1882.6 | 1679.5 | 1679.5 | 1679.5 | |
| – | 428.3 (0.1, n = 3) |
431.9 (0.2, n = 3) |
380.4 (0.2) n = 4) |
– | 390.2, 385.6 (0.0, n = 3) |
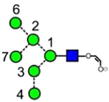
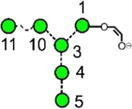
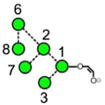
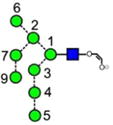
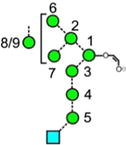
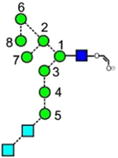
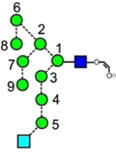
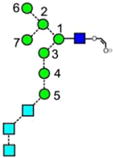
For each ion the table shows the glycan structure, the ion number (in bold), the mass and the collisional cross-section in Å2. Where multiple measurements of the CCS values were obtained, the error (from the STDEV function of Microsoft Excel) and the number (n) of measurements is given.
