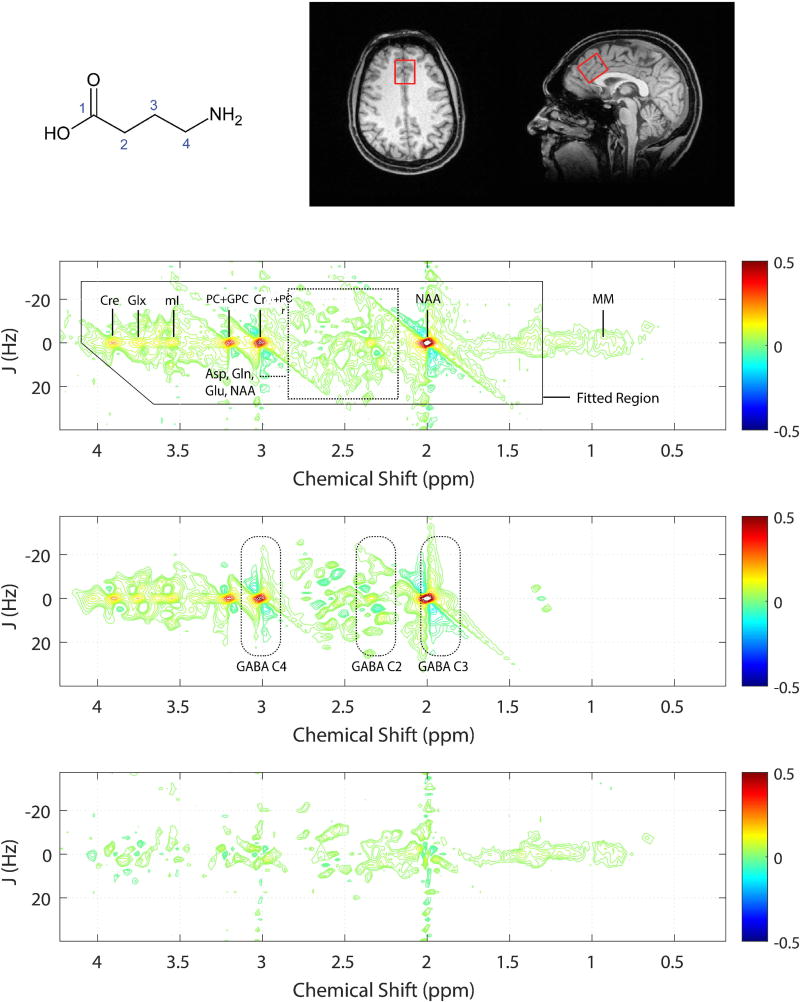
Figure 1.
Top left: GABA structure, Top right: Axial and mid-sagittal slices extracted from a tissue-segmented 3D MP-RAGE MRI dataset recorded from a single subject. Red rectangle depicts the positioning of the MRS voxel in the ACC. Fitted (top), raw (middle) and residuals (bottom) 2D-J 1H-MRS spectra analyzed using Prior Knowledge Fitting (ProFit). Dashed boxes indicate the 2D spectral regions where the GABA protons resonate. The color bars to the right show contouring amplitudes and signal phase. The raw data displayed shows tentative signal assignments for the dominant metabolite resonances as well as macromolecules (MM).

