
Fig. 5.
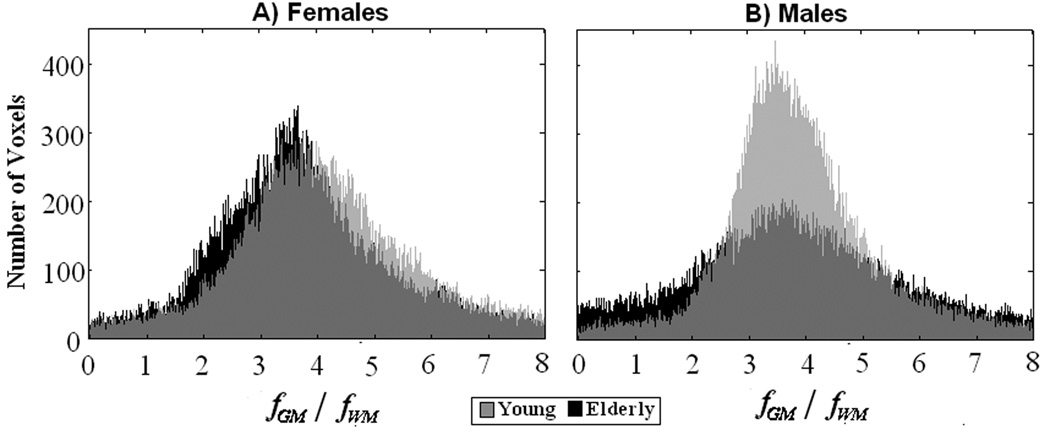
Histograms of whole brain ratios of for females (A) and males (B) are shown in black and grey for HY and HE, respectively.
Official websites use .gov
A
.gov website belongs to an official
government organization in the United States.
Secure .gov websites use HTTPS
A lock (
) or https:// means you've safely
connected to the .gov website. Share sensitive
information only on official, secure websites.
Some NLM-NCBI services and products are experiencing heavy traffic, which may affect performance and availability. We apologize for the inconvenience and appreciate your patience. For assistance, please contact our Help Desk at info@ncbi.nlm.nih.gov.
Histograms of whole brain ratios of for females (A) and males (B) are shown in black and grey for HY and HE, respectively.