
Figure 3.
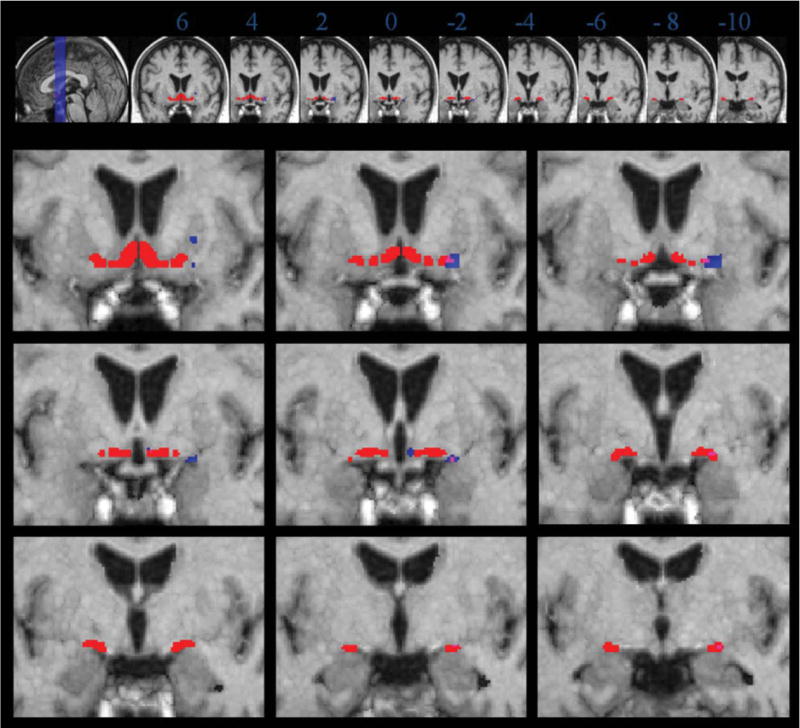
Volume reduction in MCI subjects compared to controls, age correction. Blue: volume reductions in MCI patients compared to controls in the right hemisphere. Green: volume reductions in MCI patients compared to controls in the left hemisphere. For rest of legend see legend to Figure 2.