
Figure 1.
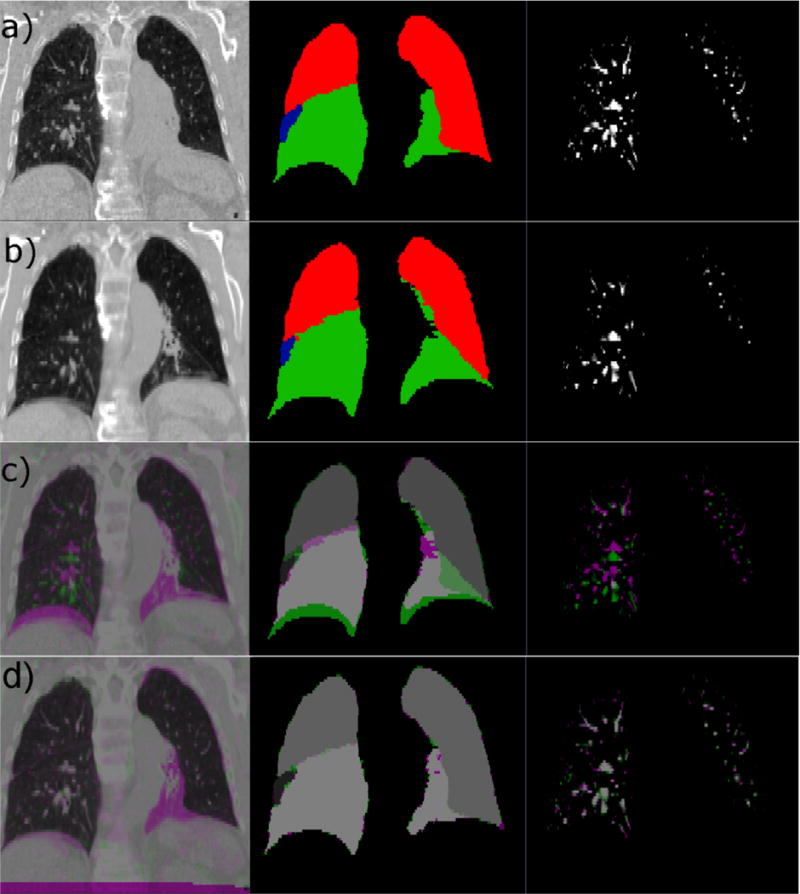
Example of input data and registration results. Input data to the CALIPER algorithm for one subject (Patient 12) is shown for (a) the baseline scan set as the fixed image of the registration and (b) the mid-treatment scan set as the moving image of the registration. The CT scans are shown in the left column, the lobe label images are shown in the middle column, and the vesselness measure images are shown in the right column. For the lobe label images, green voxels have a value of 5, red voxels have a value of 3, and blue voxels have a value of 1. (c) Complementary color overlays of the fixed (magenta) and moving (green) images are provided to illustrate the degree of initial misalignment due to differences in lung volume and changes in pathology. (d) Finally, the resulting alignment of all three datasets after registration via the CALIPER algorithm is shown.