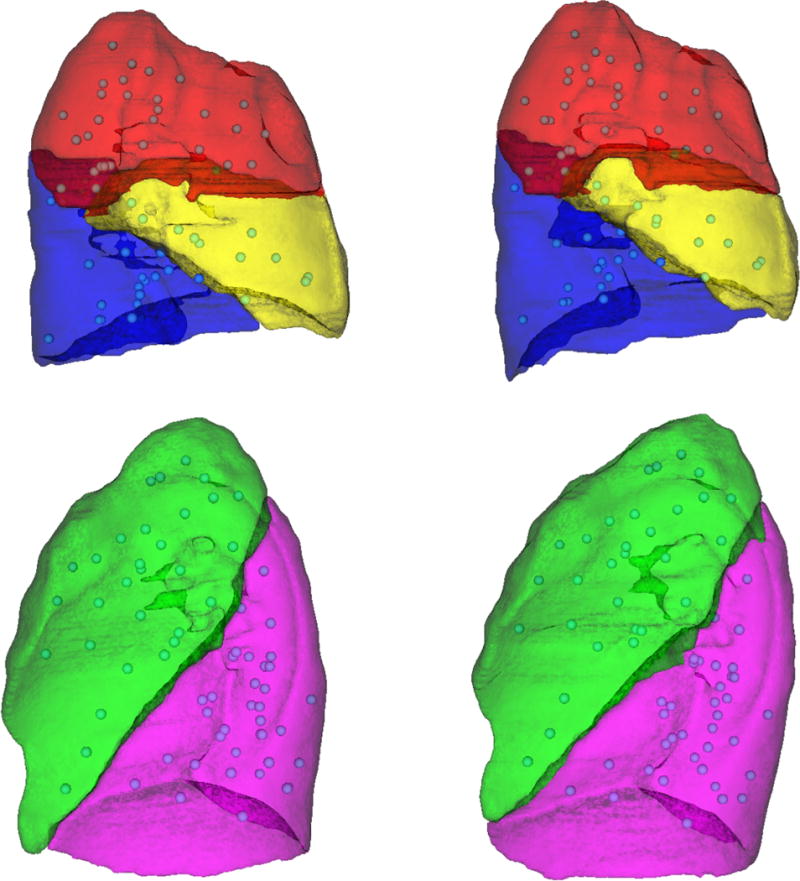
Figure 2.

Example of landmark distribution. The distribution of landmarks for a patient with partial lobar atelectasis of the right lower lobe (patient 17) is illustrated. Lateral views of the right lung lobes (top) and left lung lobes (bottom) are shown for the baseline (left) and mid-treatment (right) images. The landmarks (spheres) were sampled throughout the lung parenchyma of all lobes and were primarily located on vessels.
