
Figure 1.
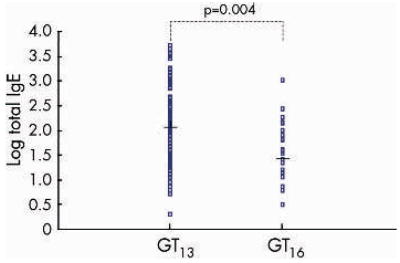
Distribution of total IgE levels in subjects with GT13 and GT16 alleles. Each point indicates the log transformed total IgE level for each individual. The number of samples: GT13 = 119, GT16 = 22. P value refers to the significance level comparing the geometric mean IgE levels of GT13 versus GT16.