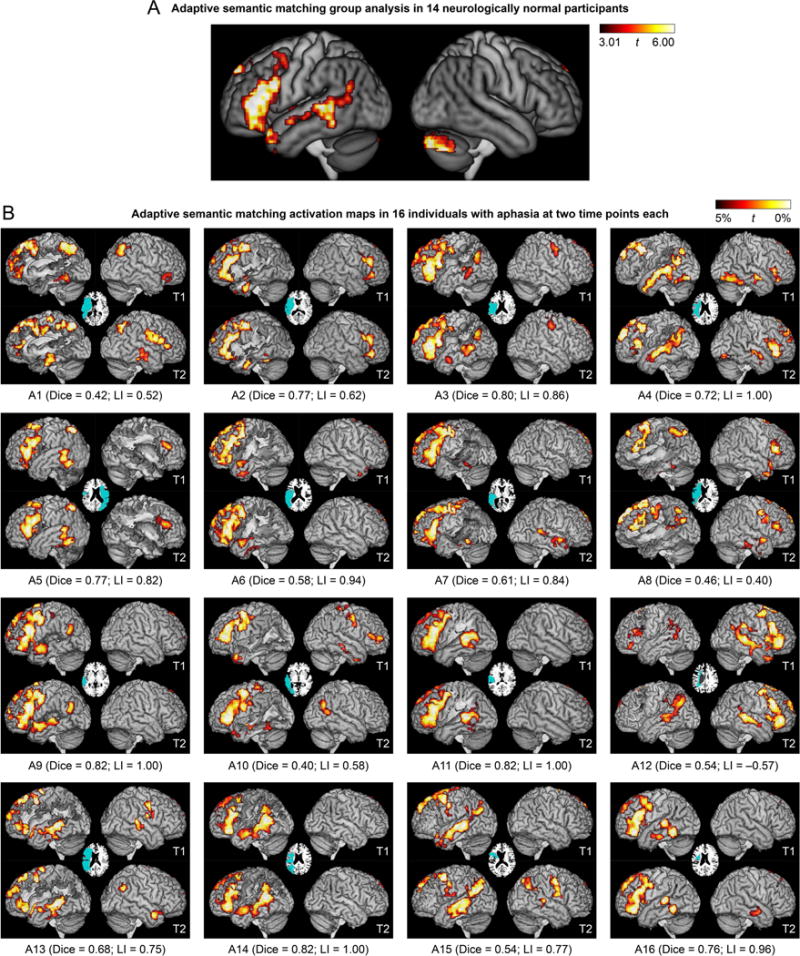
Figure 3.

Language activation maps derived from the adaptive semantic matching paradigm. (A) Group analysis in 14 neurologically normal participants. Whole brain activations were thresholded at voxelwise p < 0.005 then corrected for multiple comparisons at p < 0.01 based on cluster extent. (B) Activation maps in 16 individuals with aphasia at two time points each. The patients are arranged in groups according to clinical impression, then in ascending order of overall QAB score within each group. See Participants section, and for more detailed language data, see Figure 14 of Wilson et al. (2018), which is laid out the same way. Voxels with the highest 5% of t statistics were plotted, subject to a minimum cluster volume of 2 cm3, in an ROI comprising known language regions or plausible candidate regions for functional reorganization (Lang+ ROI); note that the cerebellum was not included (unlike panel A). Inset axial slices show lesion reconstructions. T1 = first imaging session; T2 = second imaging session; Dice = Dice coefficient of similarity; LI = lateralization index.
